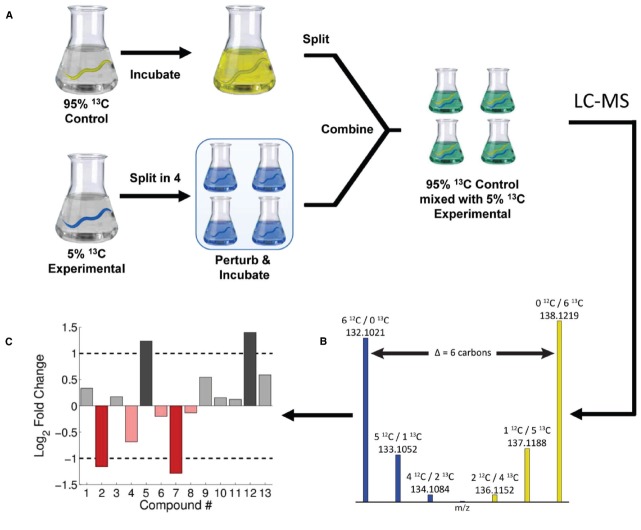
FIGURE 1.
Summary of IROA methods using C. elegans. Control and experimental populations of C. elegans were grown on 95 and 5% 13C labeled bacteria, respectively (A). The experimental population were split prior to perturbation and then combined with control yielding mixed 95 and 5% 13C populations. LC-MS analysis on IROA samples reveals isotopic peak patters that provide carbon number (B) as well as relative quantitation (C). Figure used with permission from Stupp et al. (2013).

