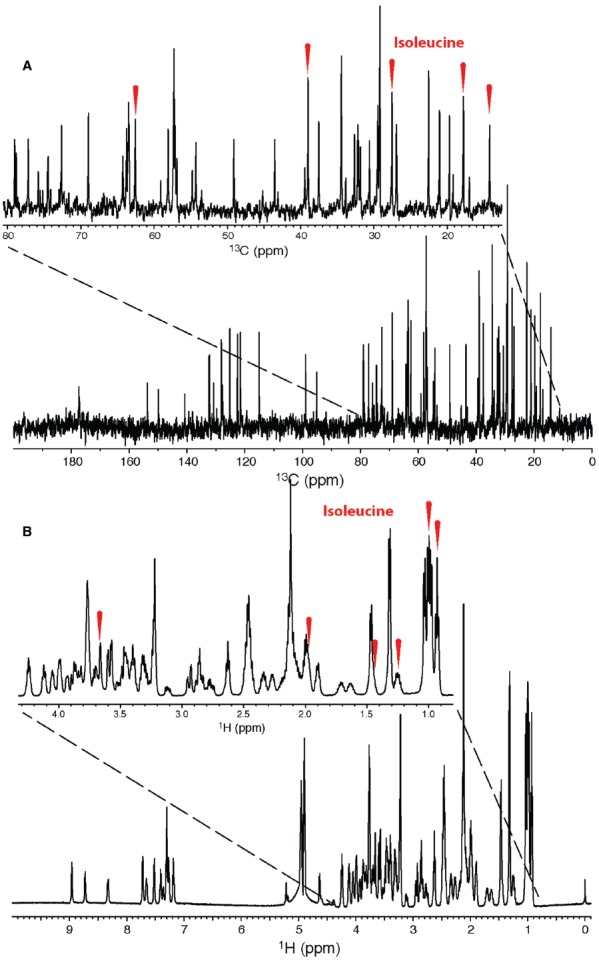
FIGURE 4.

1D 13C (A) and 1H (B) NMR spectra of a metabolic mixture. Due to the 13C spectral dispersion and narrow peaks, metabolite resonances such as those belonging to isoleucine (peaks indicated by red ticks), can be easily identified. Resonances in the corresponding 1D 1H spectrum often overlap due to coupling and small spectral width, resulting in difficult analysis. Figure used with permission from Ramaswamy et al. (2013a).
