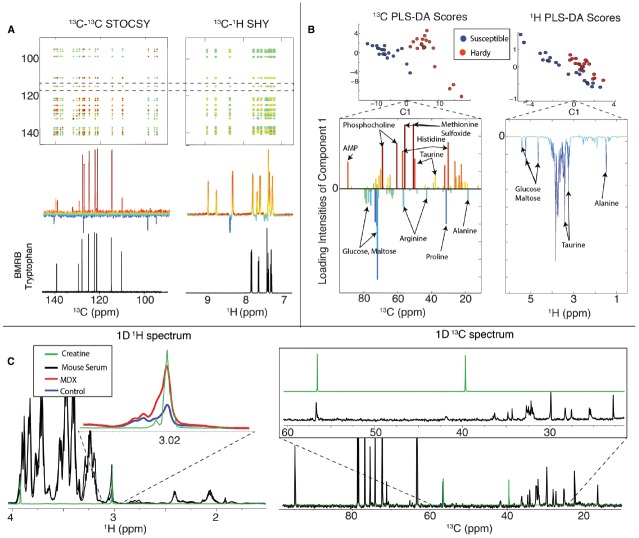
FIGURE 6.
Summary of natural abundance 13C NMR metabolomics. In (A) we show 2D STOCSY and SHY correlation maps that were produced from the same mixture of 20 common metabolites that are shown in Figure 4. We made two groups with five replicates each that had variation introduced by individual pipetting. The 2D 13C–13C STOCSY spectrum in (A) is the 13C statistical correlation map from all the 13C 1D NMR data. The 2D 13C–1H SHY is the statistical correlation map between 13C and 1H 1D NMR data. In (B) we present a summary of a PLS-DA of fruit flies that were either cold susceptible (blue) or cold hardy (red). The left side shows the PLS-DA using 13C and the right side using 1H data. The improved 13C spectral resolution greatly improves the performance in multivariate analyses, such as PLS-DA. In (C) we obtained both 1H (left) and 13C 1D NMR data from mice with a mutation in the mdx gene, which causes Duchenne muscular dystrophy in humans. The resonances around 3.02 ppm in the 1H spectrum were consistent with creatine (green), but inspection of the 13C 1D spectra on the right shows no evidence for the corresponding 13C resonances, indicating that creatine is not the major component at 3.02 ppm. Thus, 13C data can help prevent misidentifications of metabolites. This figure was adapted from Clendinen et al. (2014), where more details about these studies can be found.

