. 2015 Jul 6;4:e06942. doi: 10.7554/eLife.06942

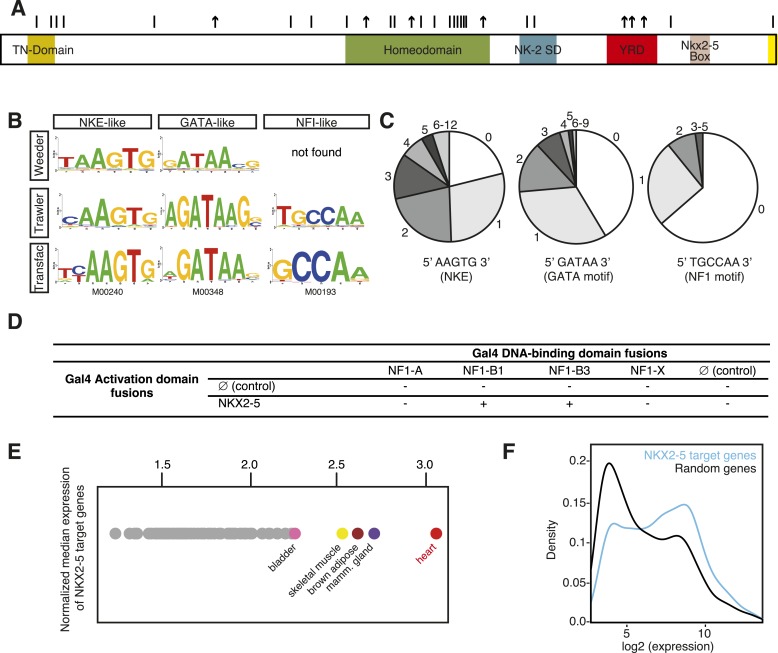
Figure 1. DNA adenine methyltransferase identification (DamID) identifies a robust set of NKX2-5 targets in HL-1 cardiomyocytes.

(A) Structure of the human NKX2-5 protein (TN, tinman domain; NK2SD, NK-2 specific domain; YRD, tyrosine-rich domain). Bars and arrows indicate missense and termination mutations associated with congenital heart disease (CHD), respectively. (B) Top over-represented motifs discovered de novo in NKX2-5 peaks using Trawler or Weeder. NKX2-5, GATA, and Nuclear Factor 1 (NF1) binding motifs deposited in TRANSFAC are shown. (C) Distribution of NKX2-5, GATA, and NF1 binding sequences in NKX2-5 peaks. (D) Yeast-two-hybrid assay. NKX2-5 and NF1 proteins were fused to Gal4-activation and DNA-binding domains, respectively. Positive signs (+) show interaction as growth on selective medium from three independent experiments. (E) Normalized median expression of NKX2-5-target genes in 91 murine cell types (data collected from BioGPS). Tissues with the highest median expressions are shown in colour, including heart (red). (F) Expression of NKX2-5 target genes and random genes in HL-1 cells. Data collected from (Mace et al., 2009).

DOI: http://dx.doi.org/10.7554/eLife.06942.003

Figure 1.

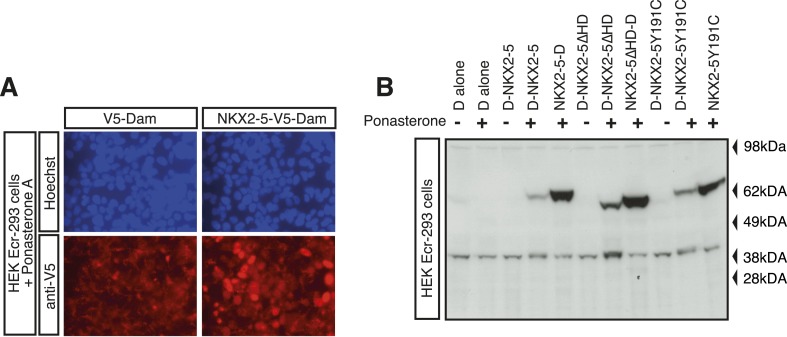
Figure 1—figure supplement 1. DamID validation in HL-1 cardiomyocytes.

Figure 1—figure supplement 1.

(A) Expression of V5-tagged DNA adenine methyltransferase (Dam) and NKX2-5-Dam in HEK Ecr-293 cells in presence of 10 mM Ponasterone A detected by immunofluorescence microscopy using anti-V5 antibodies. (B) Expression of Dam alone (‘D’) and Dam/NKX2-5 fusion proteins (WT, ∆HD, and Y191C) in HEK Ecr-293 cells in absence (−) or presence (+) of 5 mM Ponasterone A detected by western blotting using anti-NKX2-5 antibodies.

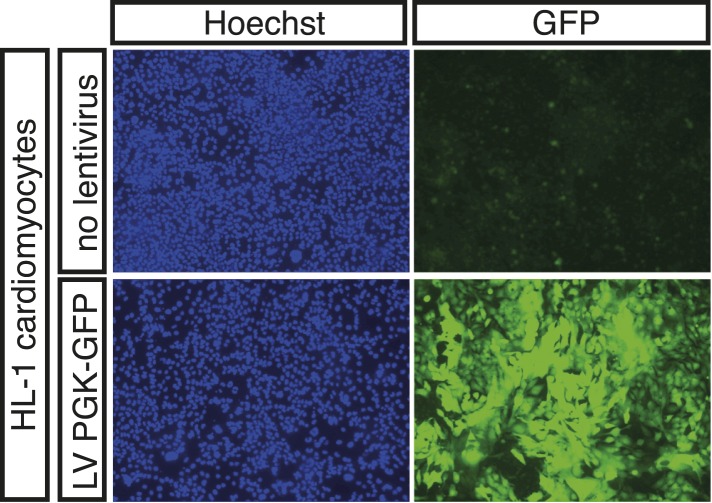
Figure 1—figure supplement 2. Expression of PGK-GFP control 24 hr post-transduction of HL-1 cells transduced with lentivirus (LV).

Figure 1—figure supplement 2.

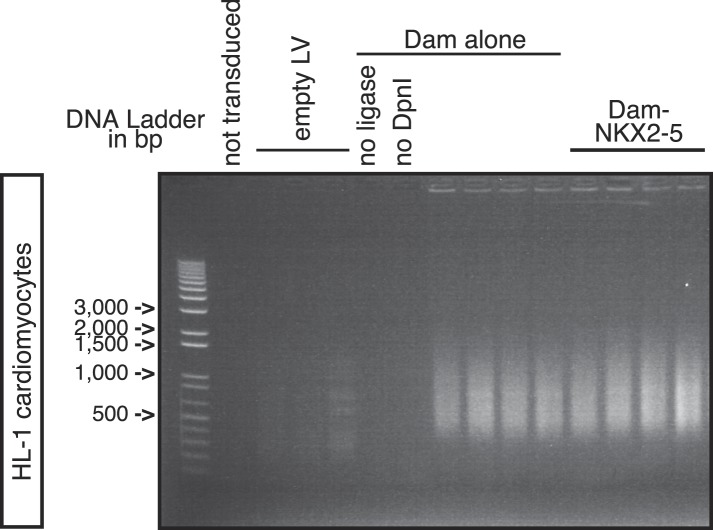
Figure 1—figure supplement 3. PCR-amplified methylated fragments of HL-1 genomic DNA 40 hr post-transduction with Dam alone and Dam-NKX2-5.

Figure 1—figure supplement 3.

Controls are ‘not transduced’ cells, or cells transduced with empty lentivirus (‘LV’), or with Dam alone and amplified with ‘no ligase’ or ‘no DpnI’.

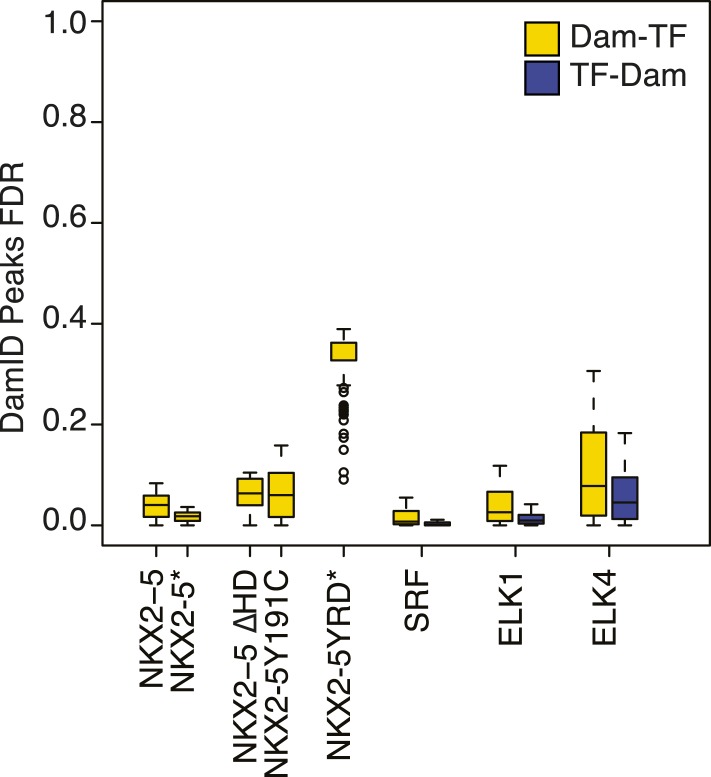
Figure 1—figure supplement 4. False discovery rate of Dam/TF fusion protein binding peaks as determined using CisGenome/TileMapv2 with moving average ≥ 3.5.

Figure 1—figure supplement 4.

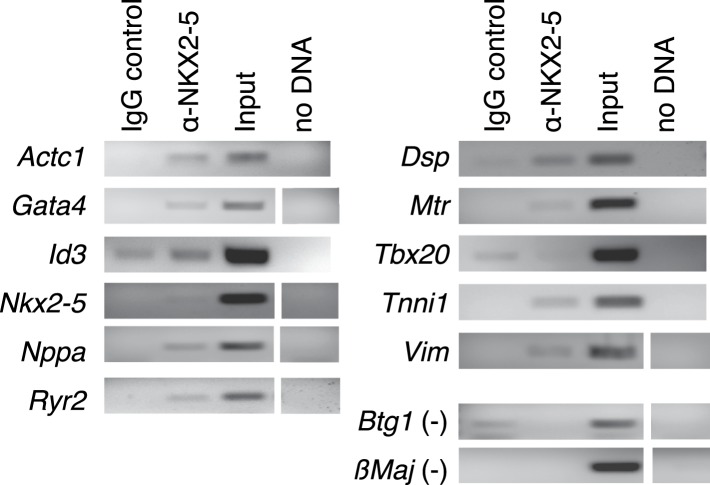
Figure 1—figure supplement 5. Chromatin immunoprecipitation (ChIP)-PCR validation of NKX2-5 WT target peakes determined by DamID.

Figure 1—figure supplement 5.

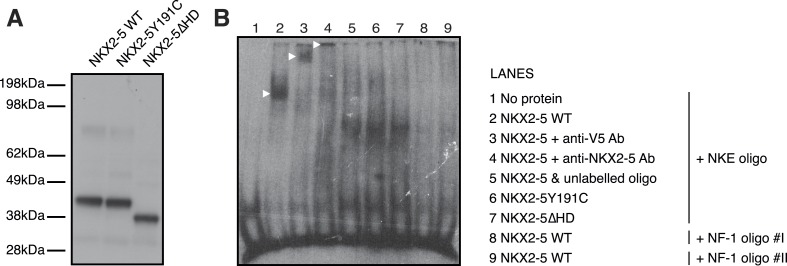
Figure 1—figure supplement 6. NKX2-5 binds the NKE but not the NF1-like motif.

Figure 1—figure supplement 6.

(A) Cell-free expression of NKX2-5 WT, NKX2-5Y191C, and NKX2-5∆HD proteins revealed by western-blotting using anti-V5 antibodies. (B) Electrophoretic mobility shift assay using NKX2-5 and DIG-labelled NKE (lanes 1–7) and NF-1 oligos (lanes 8–9). Controls include no protein (lane 1), supershifts after addition of anti-V5 (lane 3) or anti-NKX2-5 (lane 4) antibodies and competition with unlabelled oligos (lane 5). See ‘Material and methods’ for details.

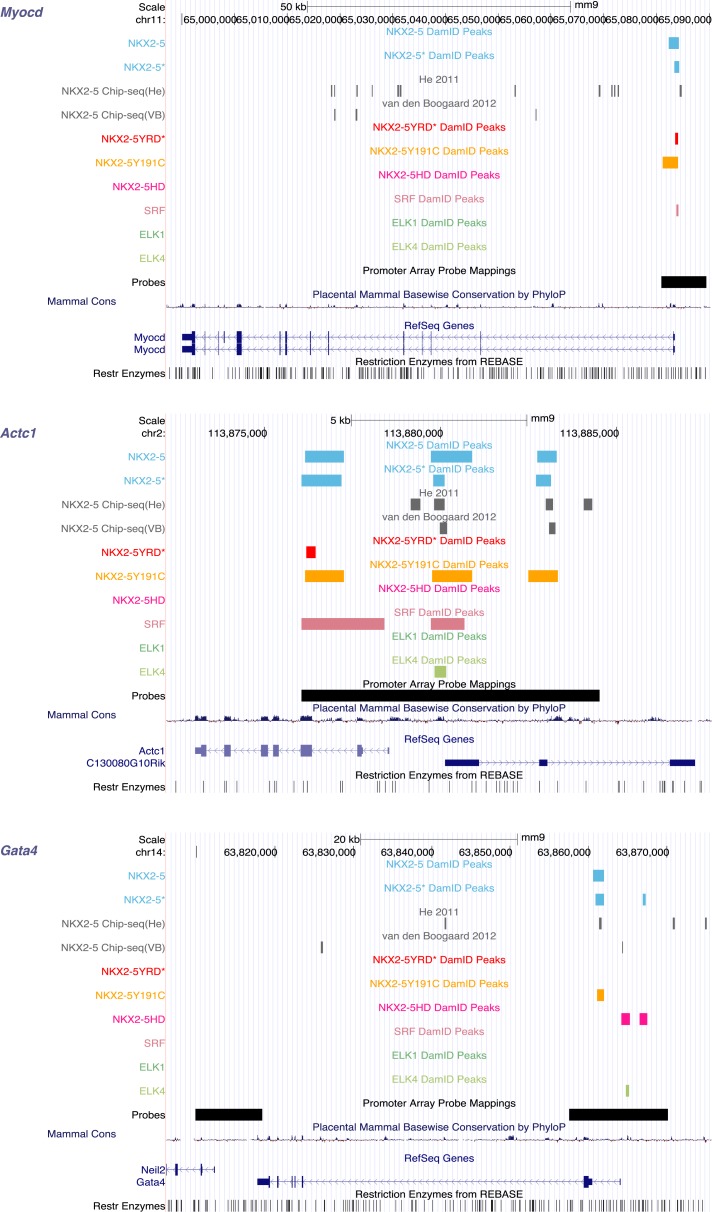
Figure 1—figure supplement 7. Identification of NKX2-5, SRF, and ELK1/4 target genes in HL-1 cells.

Figure 1—figure supplement 7.

UCSC Genome Browser screen shots showing DamID TF association in HL-1 cells with known NKX2-5 target genes (Myocd [Ueyama et al., 2003], Actc1 [Chen and Schwartz, 1997], and Gata4 [Riazi et al., 2009]).

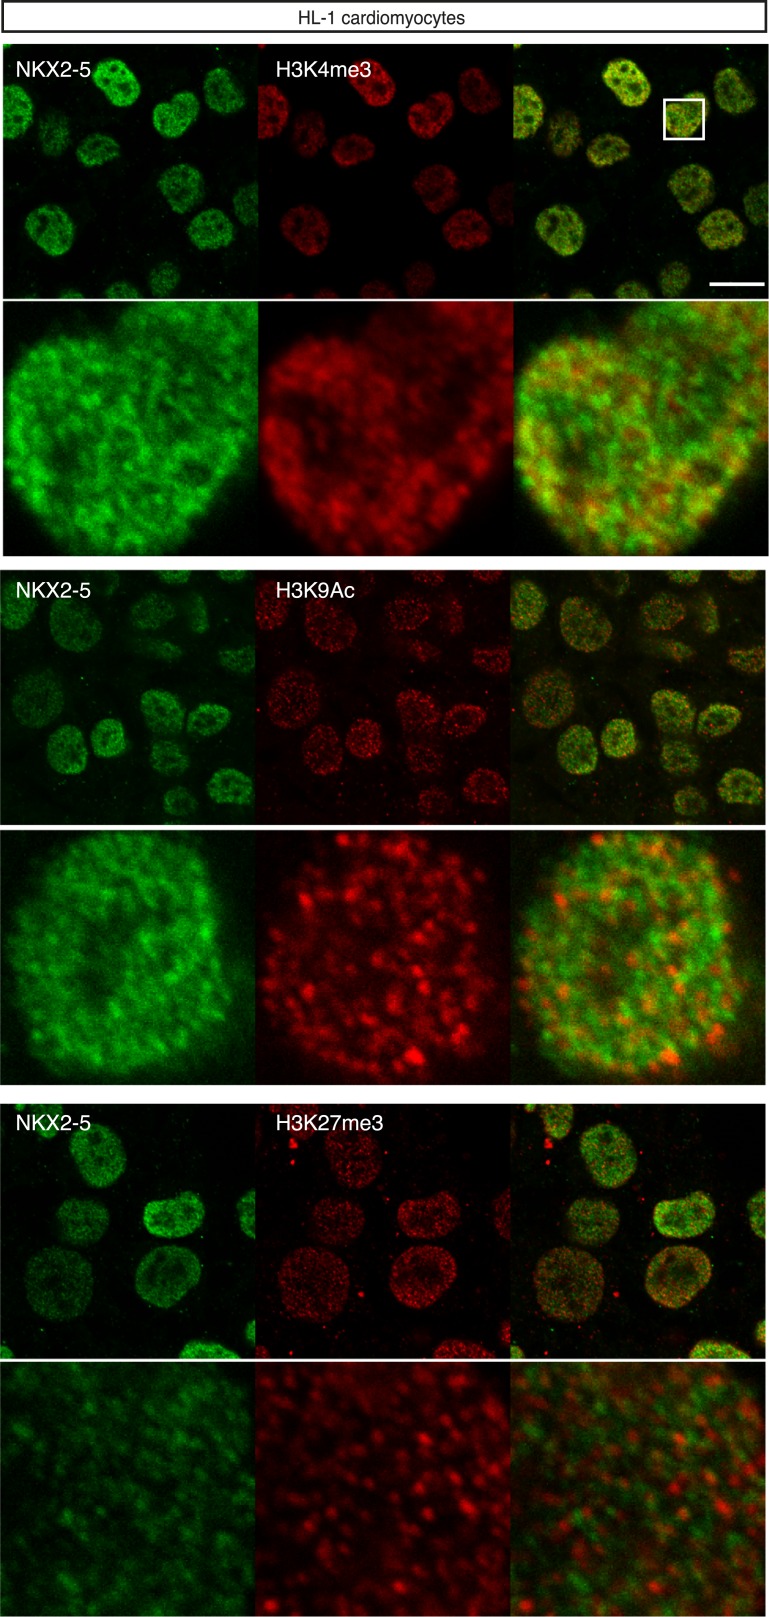
Figure 1—figure supplement 8. Nuclear localisation of NKX2-5 and histone modifications in HL-1 cardiomyocyte nuclei.

Figure 1—figure supplement 8.

Scale bars represent 10 mm.

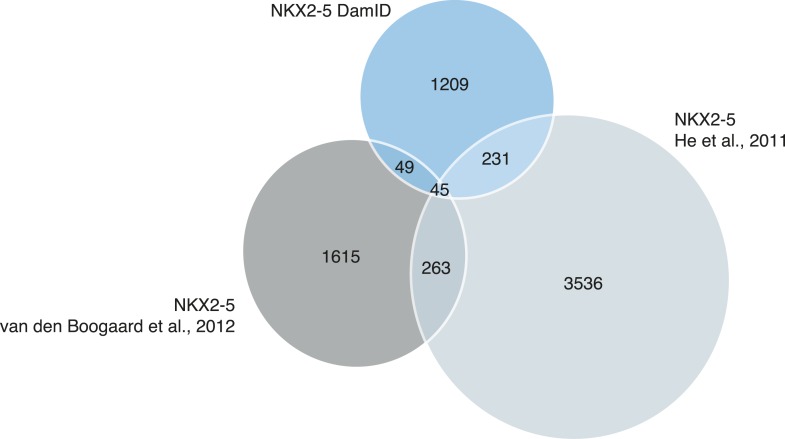
Figure 1—figure supplement 9. Proportional Venn diagram showing the overlapping binding peaks between NKX2-5 determined by DamID (this study) or ChIP-seq (He et al., 2011 ) and (van den Boogaard et al., 2012).

Figure 1—figure supplement 9.

Only peaks that fall in the regions covered by the Affymetrix mouse promoter microarrays are represented.