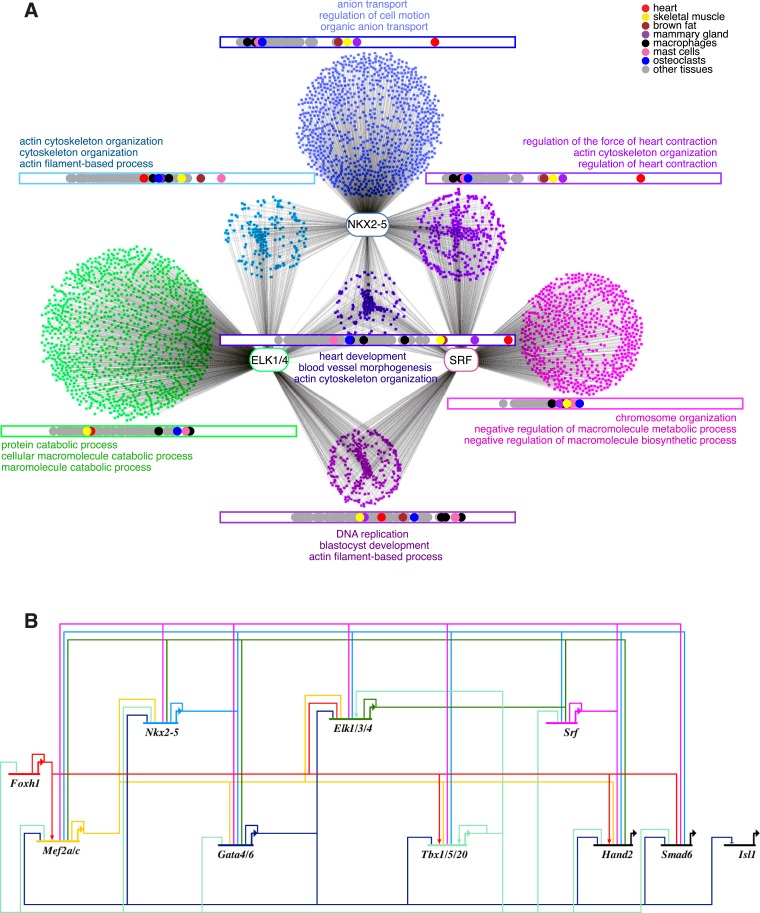
Figure 7. ELK1 and ELK4 are embedded in the cardiac gene regulatory network.
(A) Overlapping target genes between NKX2-5, ELK1/ELK4, and SRF visualised using Cytoscape (spring-embed layout). Cluster size is proportional to gene numbers. For each cluster, rectangles indicate the normalised median expression of target genes in 91 murine cell types (BioGPS). Cell types are ordered by increasing expression values from left to right. Top 3 over-represented DAVID Gene Ontology (GO) annotations are indicated for each cluster. (B) Regulatory interactions between Elk1/3/4 and cardiac TFs from DamID experiments and published data sets (network constructed with BioTapestry).

