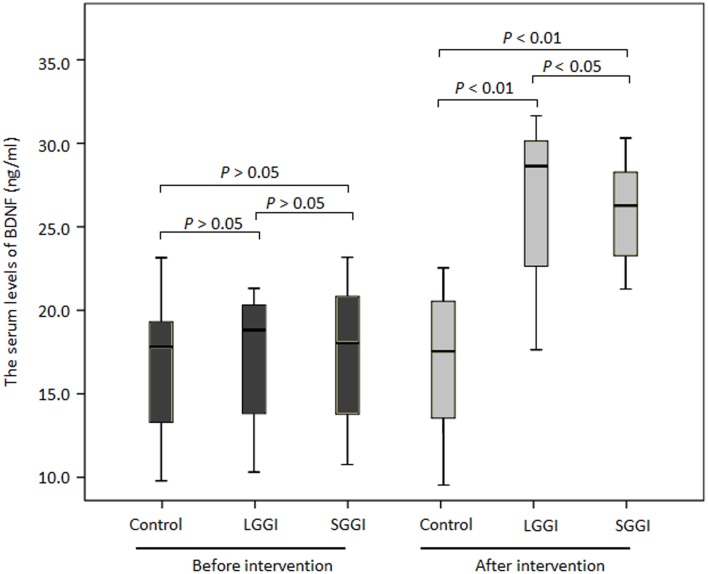
Figure 3.
Serum BDNF levels in control, LGGI and SGGI groups before and after 6-month follow-up. Comparative analyses were carried out using ANOVA followed by a Duncan test. Values were expressed as mean ± SD. N = 49 cases in each group. The bars in the boxes were average expression and the boxes represented 95% of the samples. The error bars were above or below the boxes.

