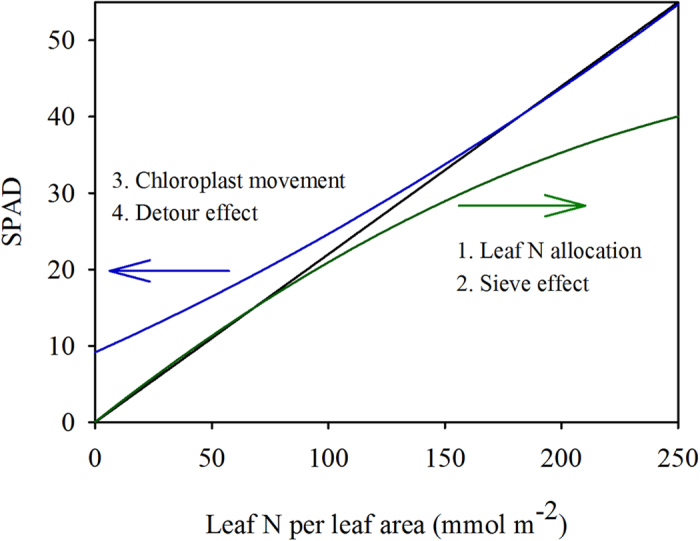
Figure 7. Summarized relationships between the SPAD values and leaf N content per leaf area in rice.

The black line represents the theoretical relationship. The blue line represents the impacts of chloroplast movement and/or detour effect. The green line represents impacts of leaf N allocation and/or sieve effect.
