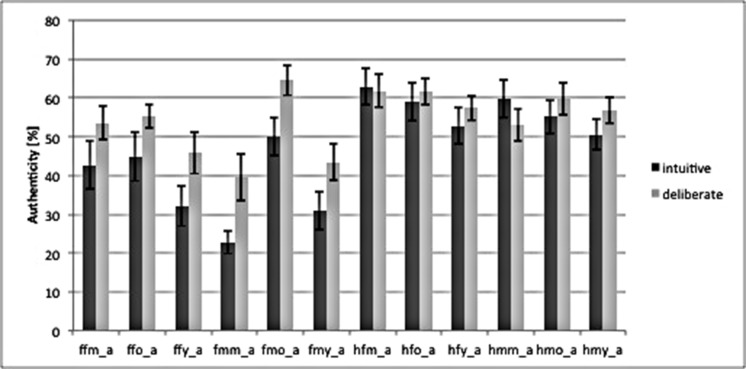
FIGURE 2.
Bar graph of authenticity judgments for both instruction-groups, based on the combination of categories in the stimulus material. ffm_a = fear, female, middle, authentic; ffo = fear, female, old; ffy = fear, female, young; fmm = fear, male, middle; fm0 = fear, male, old; fmy = fear, male, young; Labels for “happy” = h are analogous to “fear.” Behavioral data was analyzed using repeated measures analysis of variance (rmANOVA) in SPSS (SPSS Statistic 20.0, IBM, Chicago, IL, USA), as well as explorative data analysis. The frequency of behavioral scores (i.e., RT) per cell was checked for Gaussian distribution to confirm the use of rmANOVA for the analysis. Missing values were omitted. Error bars mark SEM.

