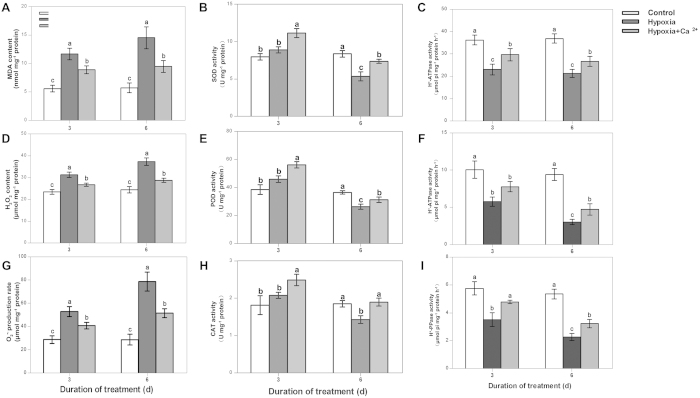
Figure 2.
Determination of changes in O2•- production and MDA and H2O2 content (A); the activities of SOD, POD, and CAT (B); plasma membrane (PM) H+-ATPase; and tonoplast H+-ATPase and H+-PPase in the mitochondria of cucumber roots at 3 d and 6 d after treatment. Samples were analyzed under normoxic conditions (Control), hypoxia treatment (Hypoxia) and hypoxia + 4 mM CaCl2 treatment (Hypoxia + Ca2+). Values are means ± SE of three independent experiments. Bars marked with dissimilar letters are significantly different according to Duncan’s multiple range tests (P < 0.05).

