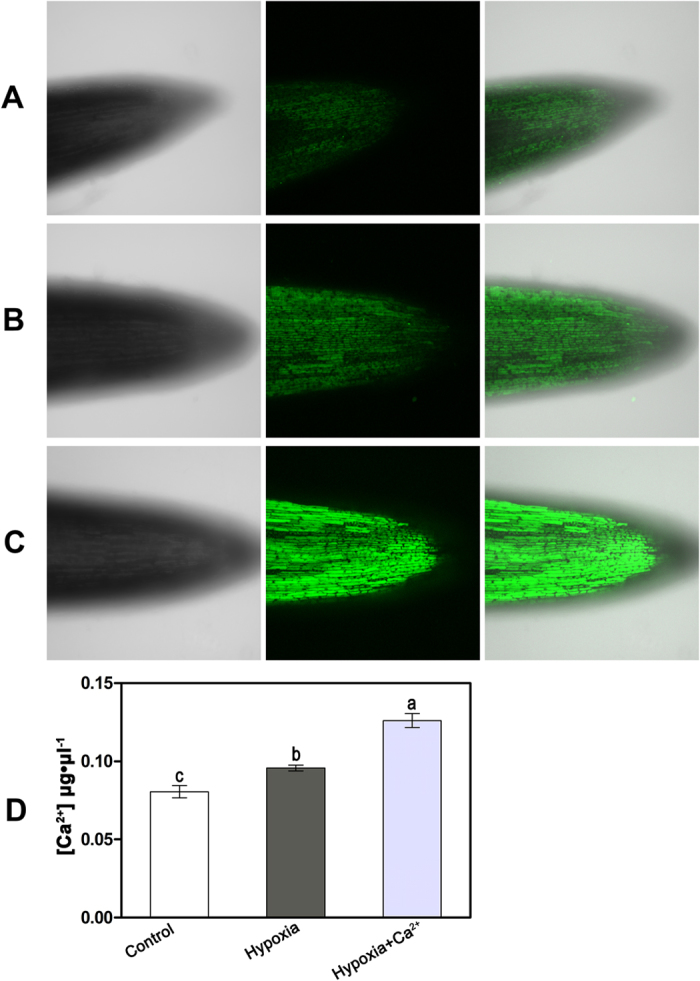
Figure 5. Detection of Ca2 + concertrations in cucumber roots tips at 3 d after treatment.

(A–C) Confocal images of cucumber roots tips by Fluo-3 AM. (A) Cucumber plants grown under normoxic conditions (Control). (B) Cucumber plants grown under hypoxic conditions (Hypoxia). (C) Cucumber plants grown under hypoxia + 4 mM CaCl2 treatment (Hypoxia + CaCl2). The signal corresponding to the incorporated Fluo-3 is green. (D) The Ca2+ content (μg•μl−1) of cucumber roots under normoxic conditions (control), hypoxic conditions (Hypoxia) and hypoxia + 4 mM CaCl2 treatment (Hypoxia + Ca2+). Values are means ± SE of three independent experiments. Bars marked with dissimilar letters are significantly different from each other according to Duncan’s multiple range tests (P < 0.05).
