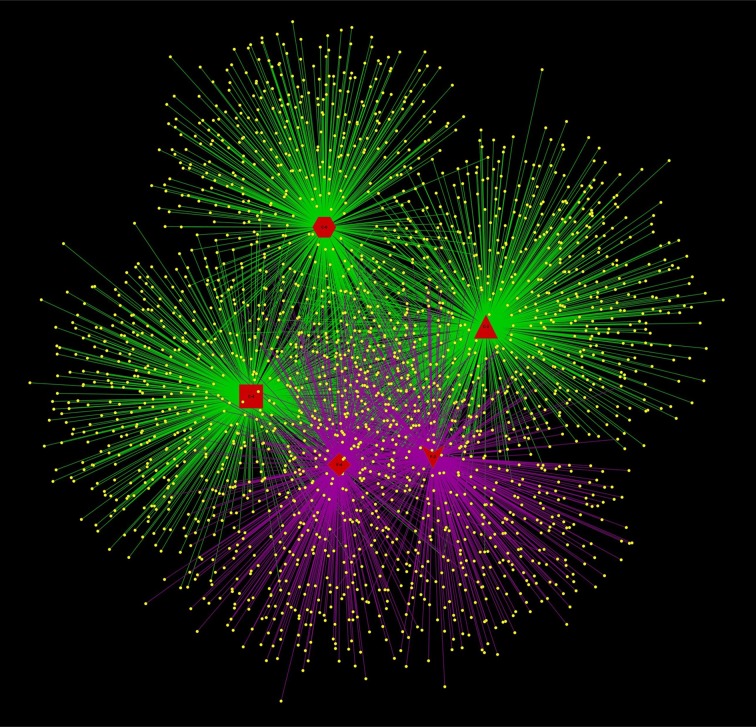
Figure 5.
Networks representing sample/OTU interaction. OTU nodes are yellow, with edges indicated according to FA treatment (purple: with FA treatment; green: without FA treatment). Sample nodes are shown in red color with different shapes according to growth time and FA treatment (Hexagon, C-0; Triangle, C-2; Rect, C-4; Vee, F-2; diamond, F-4).

