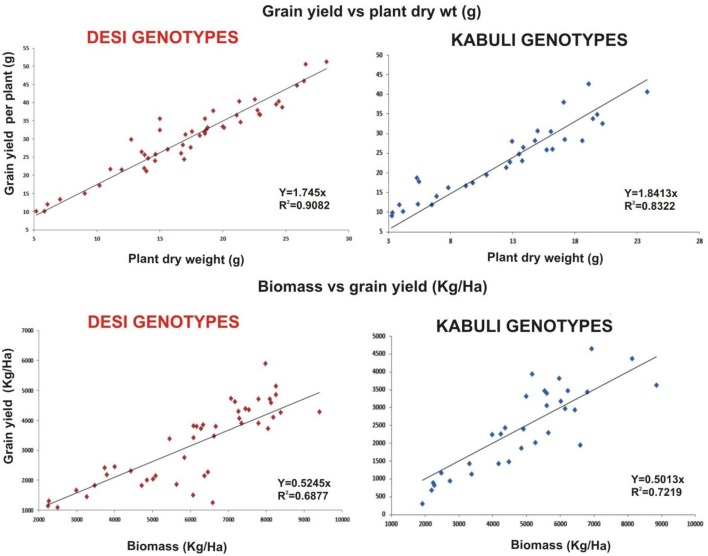
Figure 2.
Grain yield response to plant dry weight and biomass as a function of bacterial inoculation in desi and kabuli chickpea genotypes in two soils. The data from two soils and four treatments has been jointly loaded on graph to evaluate the response of genotypes. Graph shows a positive linear relationship of plant dry weight to grain yield per plant and plant biomass to grain yield in both genotypes with significnalty higher R2-values.

