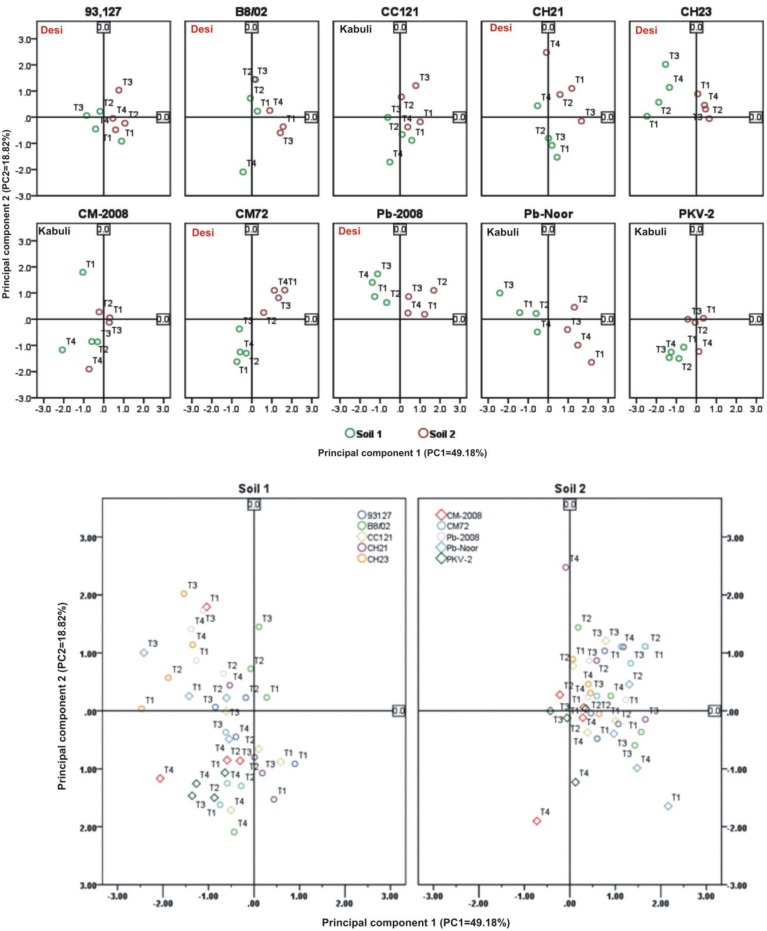
Figure 4.
Principal component analysis (PCA) showing the response of chickpea genotypes after four bacterial inoculation treatments in two different soils; Loaded as genotypes (upper panel) and soil type (lower panel) (Total variance explaiened: 68%). T1 = Ca-34T, T2 = TAL-1148, T3 = Ca-34T+TAL-1148, T4 = non-inoculated Control.

