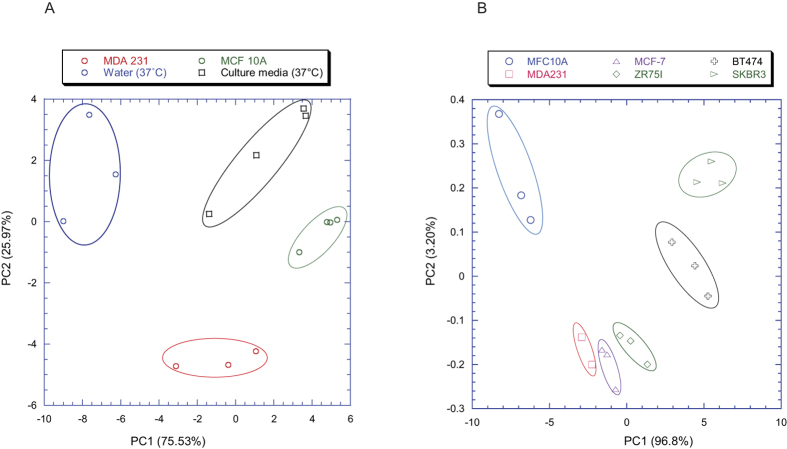
Figure 4. Clustering relationship of self-modulated sensor outputs.
(A) Score plots of the first two principal components built with sensor data. A clear separation is observed among the MCF10A non-transformed control cell line (encircled in green), MDA231 cancer cell line (encircled in red), culture media without cells (encircled in black) and distilled water (encircled in blue). (B) Score plots of the first two principal components built with sensor data. A comparison of the sensor responses for the MCF-10A breast control cell line and five breast cancer cell lines (MDA231, MCF-7, ZR751, BT474, SKBR3) is shown.

