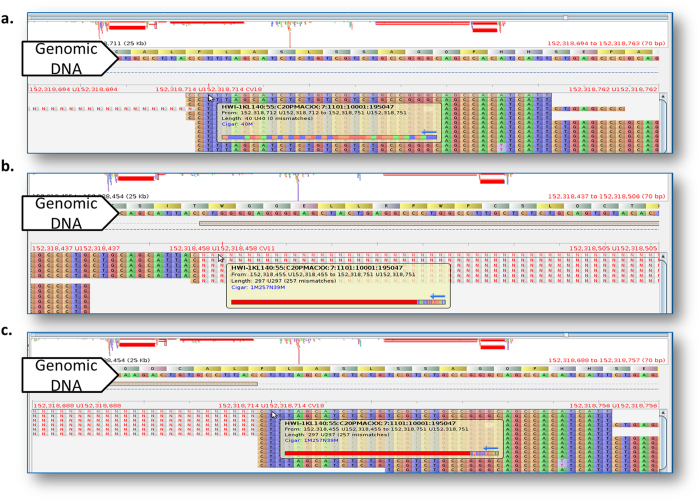
Figure 3. An example of Scenario 2 & 3.
Read mapping (highlighted with red line) is identified as Scenario 2 and Scenario 3 by CADBURE and visualized in Tablet26. Tablet shows reads mapped against the mouse reference genome. The same read (name shown in popup) is mapped differently to the genome by GSNAP and TopHat2 aligners. (a) GSNAP mapped the same 40 base read perfectly with no mismatches to Chromosome 2 from 152,318,712 to 152,318,751. (b) TopHat2 mapped the same read with a spliced alignment to Chromosome 2 with 1 base at 152,318,455, leaving a long gap for an intron (257 bp; from 152,318,456 to 152,318,712; displayed with ‘N’) and then (c) TopHat2 mapped 39 bases continuously from 152,318,713 to 152,318,751.

