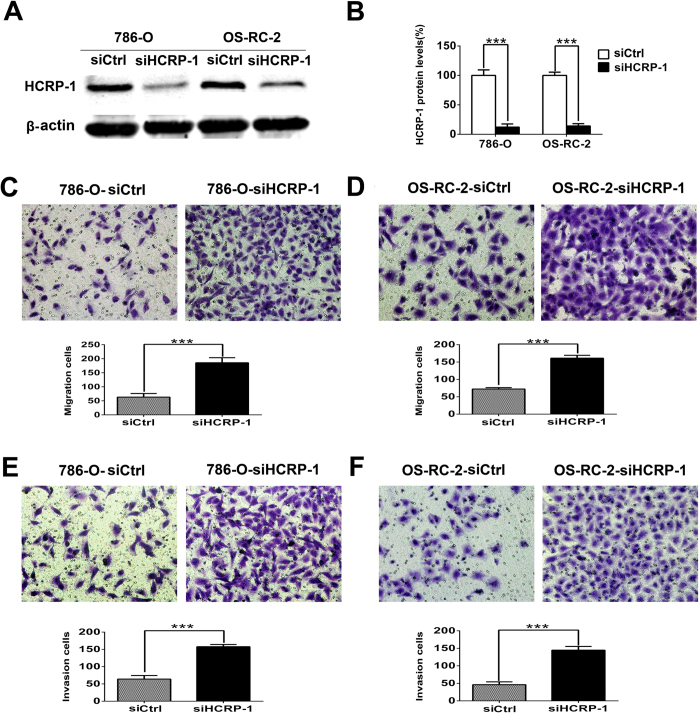
Figure 3. Effect of the reduction in HCRP-1 expression on the abilities of cell motility in vitro.
(A,B) Forty-eight hours after transfection, the expression of HCRP-1 in the 786-O and OS-RC-2 cells was evaluated by western blotting. β-actin was used as an internal control. (C–F) Cell migration and Matrigel cell invasion assays were performed in 786-O and OS-RC-2 cells after transfection, respectively. Representative fields of migrating or invading cells on the membrane (magnification, ×200). The data are presented as mean ± SD for triplicate determinations. ***P < 0.001.

