
Fig. 3.
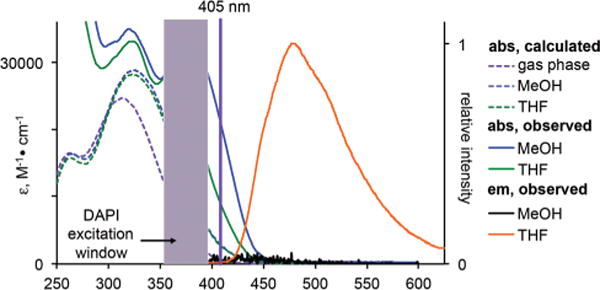
Calculated (dashed lines) versus experimentally measured solution (solid lines) spectra of lapatinib. The solution spectra are slightly red-shifted when compared to the TD-DFT predicted spectra and extend into the visible spectrum enabling excitation with near-UV or violet sources; the typical window for a DAPI filter set and the 405 nm laser line are show. While lapatinib is emissive in a relatively non-polar solvent like THF (orange line), fluorescence is quenched in methanol (black line at bottom). 10 μM and 1 μM solutions were used for absorption and emission spectroscopy, respectively.