
Fig. 6.
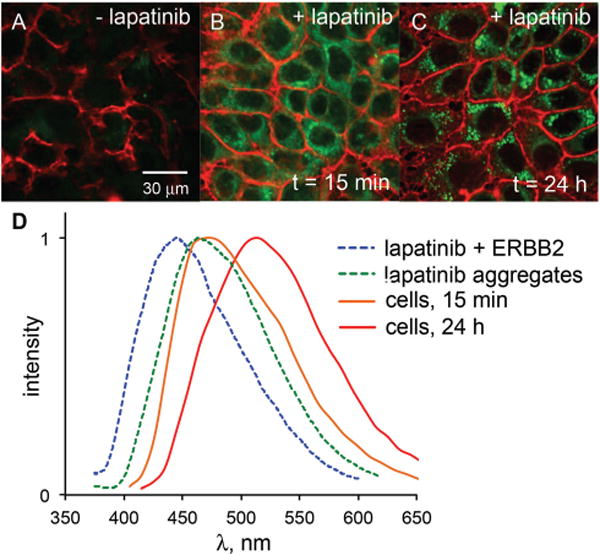
A comparison of ERBB2-overexpressing MCF7 cells without lapatinib (A), after 15 min of 3 μM lapatinib treatment (B) and 24 h of lapatinib treatment (C) reveals the turn-on fluorescence of intracellular lapatinib. All images were captured under identical conditions (e.g. laser intensity, detector gain, exposure time). The emission spectrum (D) of lapatinib at 15 min (orange line) closely matches that of lapatinib aggregates in PBS solutions (green dashed line). At longer time points, the emission is red-shifted (red line); emission of ERBB2-bound lapatinib (blue dashed line) is not observed either at the cell membrane or intracellularly.