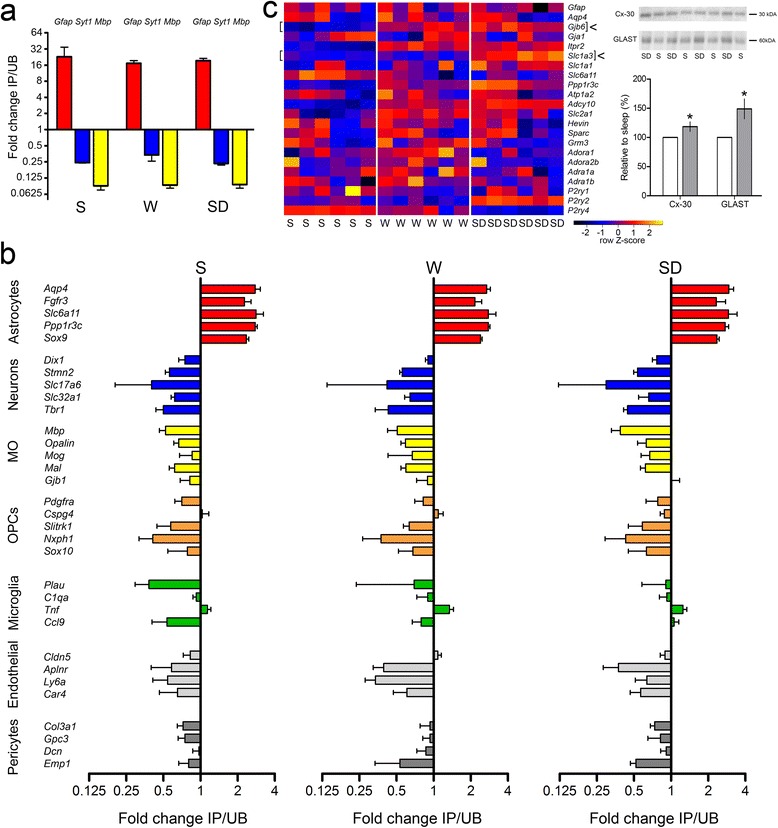
Fig. 3.

Enrichment analysis of ALDH1L1 – eGFP-L10a IP samples. a qPCR expression (mean ± standard deviation, n = 6, two per group for IP, n = 6, two per group for UB) of the cell-specific marker for astrocytes (Gfap) is consistently enriched in the IP RNA across all groups (S, W and SD), whereas the negative controls (Mbp for oligodendrocytes, Syt1 for neurons) are consistently enriched in the UB samples. b Histograms showing IP/UB ratios expressed in log2 fold change for S, W and SD samples. In all three experimental groups, the genes identified by [25] as specific for astrocytes (red) are enriched in IP samples, whereas the genes specific for neurons (blue), mature oligodendrocytes (MO, yellow), oligodendrocyte precursor cells (OPCs, orange), microglia (green), endothelial cells (light grey) and pericytes (dark grey) are enriched in S, W and SD UB samples. c Heat diagram (left) showing the expression intensities of several common astrocytic genes in each individual S, W and SD mouse. Arrows indicate gjb6 and slc1a3, the two astrocytic genes selected for Western blot analysis (right): Cx-30 (+19 ± 8 %, Mann–Whitney (MW), P = 0.02), GLAST (+49 ± 17 %, MW, P = 0.02) in SD (n = 4, grey bars) relative to S (n = 4, white bars). Representative bands from S and SD pools (n = 4 mice per pool) are depicted above each bar for Cx-30 and GLAST
