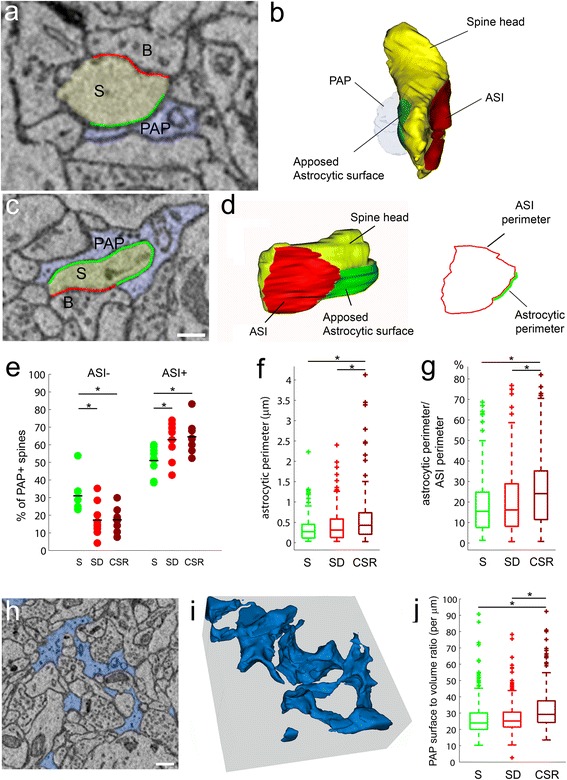
Fig. 6.

Wake brings astrocytic processes closer to the synaptic cleft. a–d Examples of electron microscope images showing PAP+ASI– (a) and PAP+ASI+ (c) spines, with their relative tridimensional reconstructions (b, d). PAPs are depicted in light blue and spine heads (S) are in yellow. B = presynaptic bouton, A = axon, D = dendrite. The ASI is traced in red and the apposed astrocytic surface on the spine head is in green. Scale bar = 250 nm. In (b), the PAP embracing the spine (*) has been made transparent to allow a view of the spine head underneath. Note that the apposed astrocytic surface (green) does not reach the ASI (red). In (d), the orientation of the structure shows the contact between the apposed astrocytic surface (green) and the ASI. The line drawing on the right shows the ASI perimeter (red) and the astrocytic perimeter (red) in 3D. e Percentage of PAP+ASI– and PAP+ASI+ spines per dendrite in layer II cortical fields for S (n = 9 dendrites; PAP+ASI–, 31.1 ± 9.6 %; PAP+ASI+, 51.09 ± 7.88 %), SD (n = 9 dendrites; PAP+ASI–, 17.38 ± 9.45 %; PAP+ASI+, 62.93 ± 10.55 %) and CSR (n = 8 dendrites; PAP+ASI–, 17.51 ± 7 %; PAP+ASI+, 64.53 ± 9.34 %). PAP+ASI–, S vs SD, MW, * P = 0.01; S vs CSR, MW, *P = 0.001; PAP+ASI+, S vs SD, MW, * P = 0.02; S vs CSR, MW, *P = 0.0033. f Astrocytic perimeter in S (n = 148, 0.35 ± 0.32 μm), SD (n = 207, 0.42 ± 0.4 μm) and CSR (n = 171, 0.59 ± 0.63 μm). SD vs CSR, MW, *P = 0.002; S vs CSR, MW, *P < 0.0001. g Astrocytic perimeter to ASI perimeter ratio in S (n = 148, 18.66 ± 14.83 %), SD (n = 207, 19.77 ± 15.79 %) and CSR (n = 171, 25.25 ± 17.08 %). SD vs CSR, MW, *P = 0.0001; S vs CSR, MW, *P = 0.0005. h, i Example of portion of neuropil occupied by PAP (depicted in light blue) and its relative 3D reconstruction. Scale bar = 300 nm. j PAP surface-to-volume ratio in S (n = 314, 27 ± 13 per μm, S vs CSR, MW, *P < 0.0001), SD (n = 365, 27 ± 12 per μm, SD vs CSR, MW, *P < 0.0001) and CSR (n = 307, 33 ± 13 per μm). All values are mean ± standard deviation
