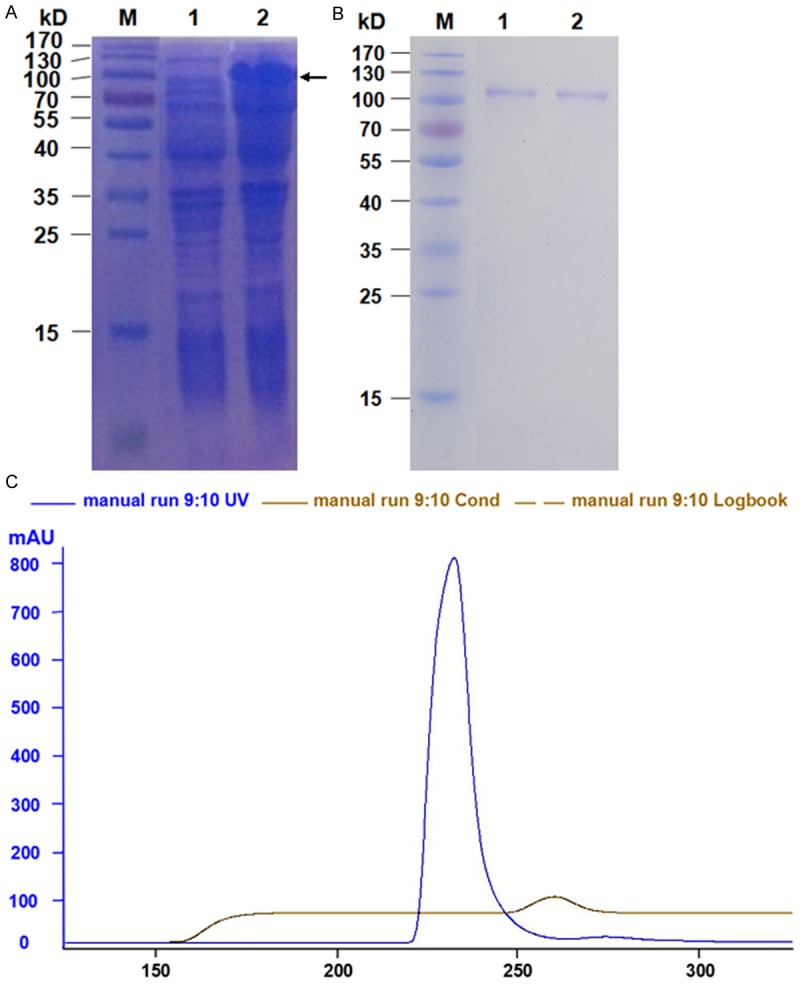
Figure 2.

Expression and purification of Der f (A) SDS-PAGE analysis of the protein expressed from the pET-44a (+)-Der f 27 recombinant plasmids in E. coli BL21 cells. Lane M: Protein Marker; Lane 1, E. coli BL21 transformed with pET-Der f 27 without IPTG induction; Lane 2, E. coli BL21 transformed with pet-Der f 27 with IPTG induction. (B) The peak figure of recombinant Der f 27 purified by molecular sieve chromatography. The longitudinal axis (mAu) is a protein absorption peak; Horizontal axis (ml) for volume; Blue curve for protein absorption peak; Gray curve for conductance value. (C) SDS-PAGE analysis of the final purified r-Der f 27 from E. coli BL21 cells. Lane M: Protein Marker. Lane 1-2: r-Der f 27 purified by molecular sieve chromatography.
