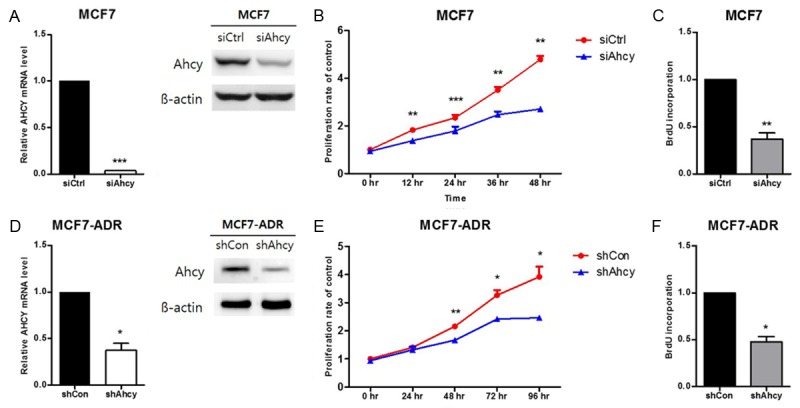
Figure 3.

Effect of AHCY-knockdown in breast cancer cells. A, D. The AHCY expression levels in the cells used in the proliferation assay were confirmed by qRT-PCR and western blot and 30 µg proteins are loaded per well. The graphs show mean ± SD of three independent experiments. *means P<0.05 and ***means P<0.005. B, E. Cell proliferation rate of MCF7 and MCF7-ADR cells was detected by staining with the 10% solution of WST-1 for 48 and 96 h. The graphs show mean ± SD of three independent experiments. *means P<0.05, **means P<0.01 and ***means P<0.005. C, F. BrdU incorporation was measured after 2 h of staining by thymidine. The graphs show mean ± SD of three independent experiments. *means P<0.05 and **means P<0.01.
