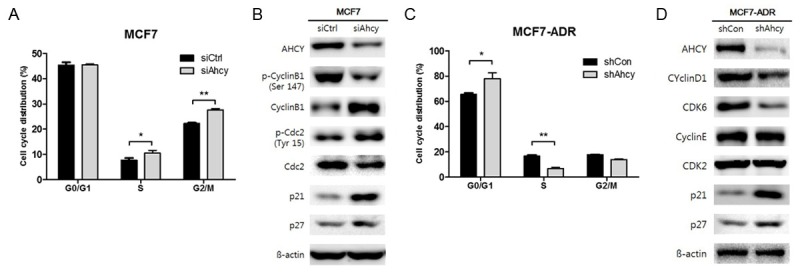
Figure 6.

Cell cycle arrest by AHCY inhibition in breast cancer cells. A, C. The number of cells treated with propidium iodide (PI) for DNA staining in various stages of the cell cycle were quantified by measuring the area under the peaks. The cells in each phase were normalized to the total cells stained with PI. The graphs show mean ± SD of three independent experiments. *means P<0.05 and **means P<0.01. B, D. The expression of cell cycle proteins was detected by western blotting analysis in both MCF7 and MCF7-ADR cells and 30 µg proteins were loaded per well.
