
Figure 2.
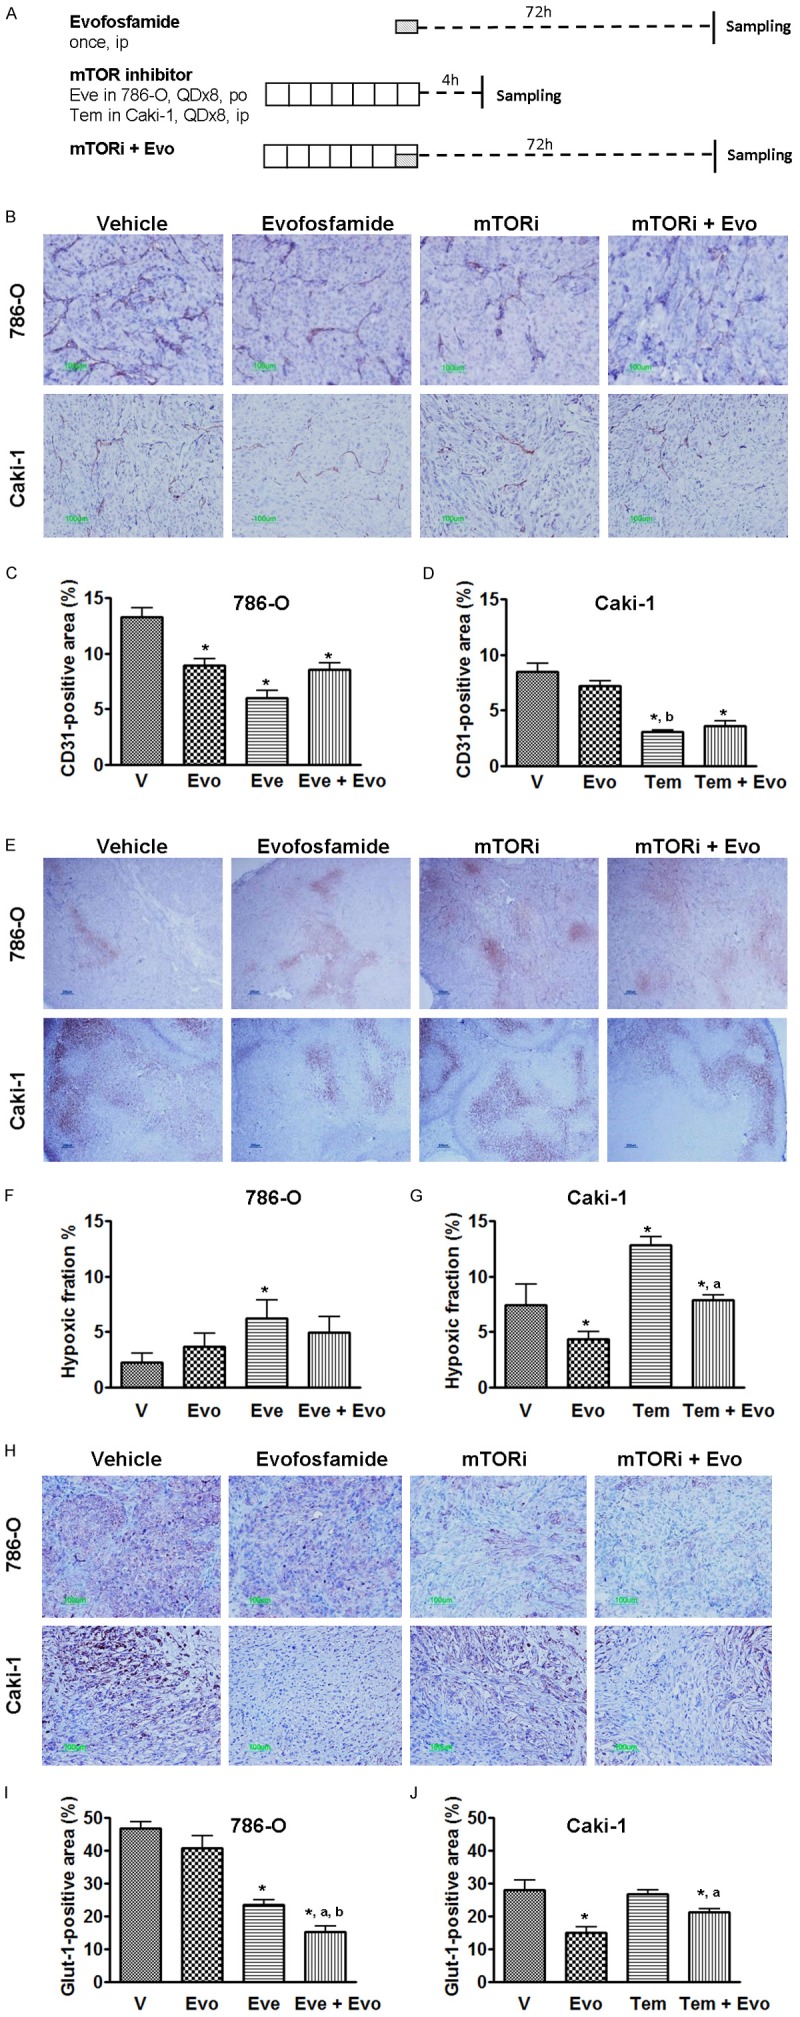
Effect of evofosfamide in combination with mTOR inhibitors on tumor angiogenesis and hypoxia. A. Treatment schedule and experimental design; Tumor-bearing animals received evofosfamide, 150 mg/kg, ip, everolimus 5 mg/kg, po in the 786-O xenografts; and temsirolimus 20 mg/kg, ip in the Caki-1 xenografts. B, E and H. Representative images of CD31, pimonidazole and Glut-1 immunostaining, respectively; C and D. Morphometric analysis of tumor microvessel density; F and G. Morphometric analysis of tumor hypoxic fraction. I and J. Morphometric analysis of percentage of Glut-1 expression inside the tumor. *, P < 0.05 as compared to Vehicle. a, P < 0.05 as compared to mTOR inhibitor monotherapy. Each bar represents Mean ± SEM of 5-8 animals per group. Evo, evofosfamide; mTORi, mTOR inhibitor; Eve, everolimus; and Tem, temsirolimus.