
Figure 3.
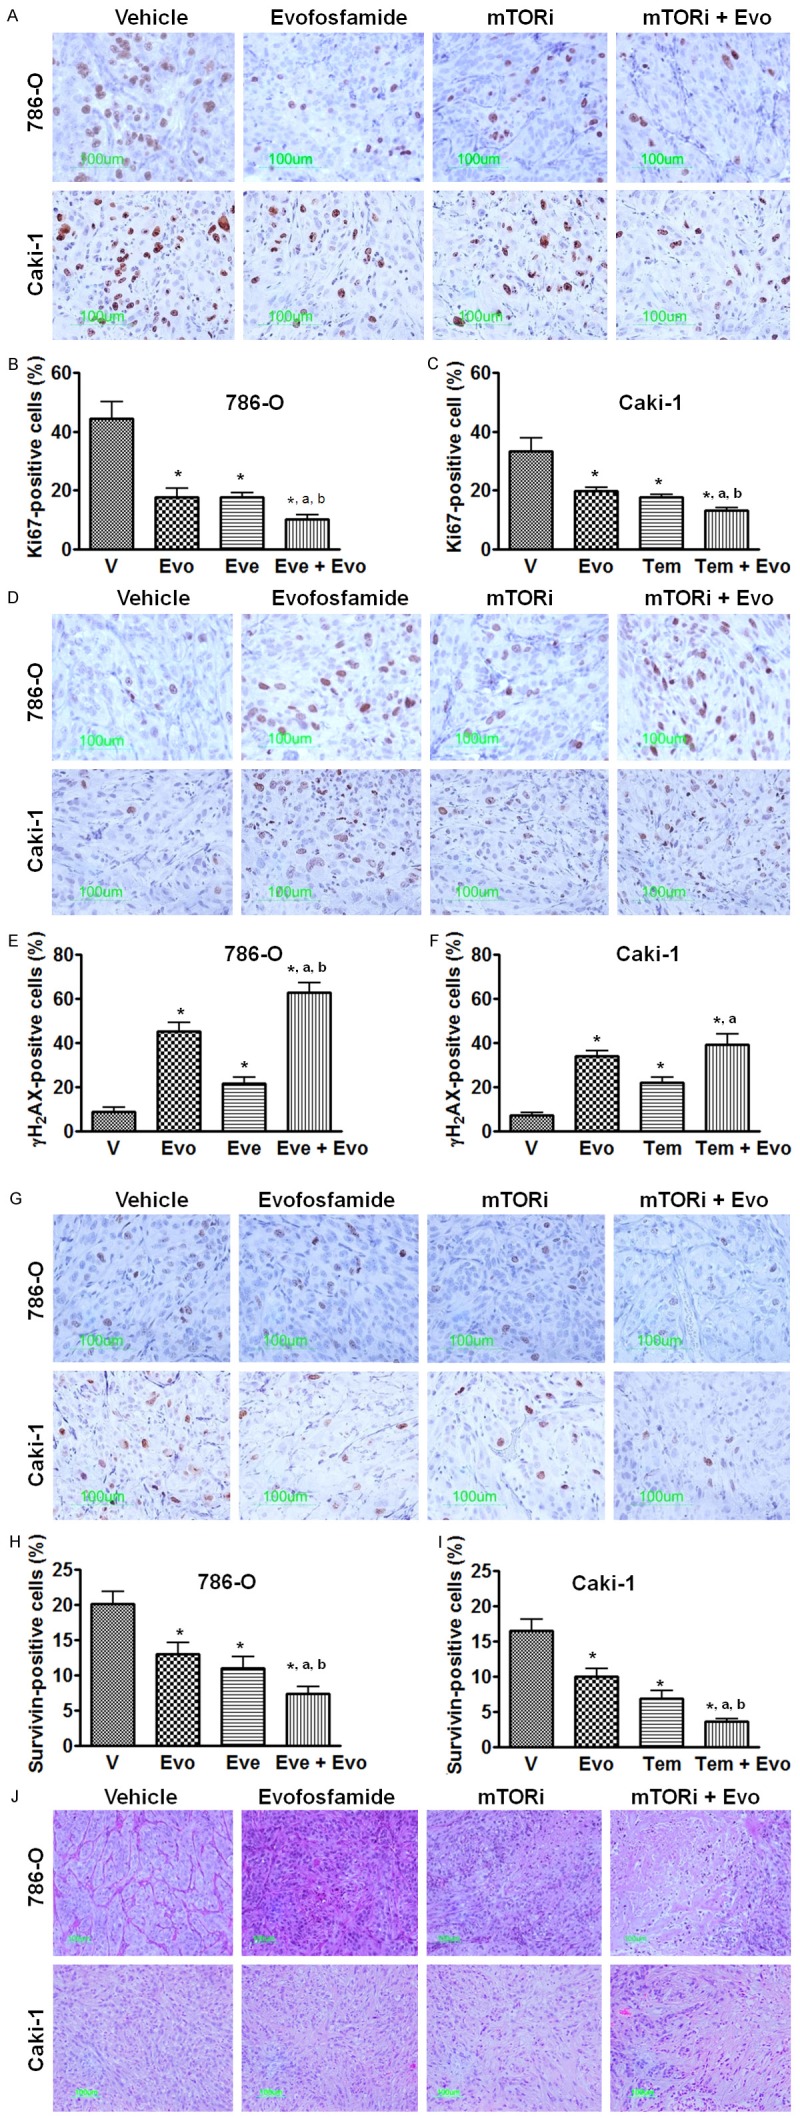
Effect of evofosfamide in combination with mTOR inhibitor on cell proliferation, DNA damage, and survivin expression. Everolimus and temsirolimus were used in the 786-O and Caki-1 xenografts, respectively. A. Representative images of Ki67 immunostaining, a marker of cell proliferation; B and C. Morphometric analysis of percentage of Ki67 positive cells inside the tumor; D. Representative images of γH2AX immunostaining, a marker of DNA damage; E and F. Morphometric analysis of percentage of γH2AX positive tumor cells; G. Representative images of survivin immunostaining; H and I. Morphometric analysis of percentage of survivin positive cells inside the tumor. J. Representative images of H. & E. Histology staining. *, P < 0.05 as compared to Vehicle. a, P < 0.05 as compared to mTOR inhibitor monotherapy; b, P < 0.05 as compared to evofosfamide monotherapy. Each bar represents Mean ± SEM of 5-8 animals per group. Evo, evofosfamide; mTORi, mTOR inhibitor; Eve, everolimus; and Tem, temsirolimus.