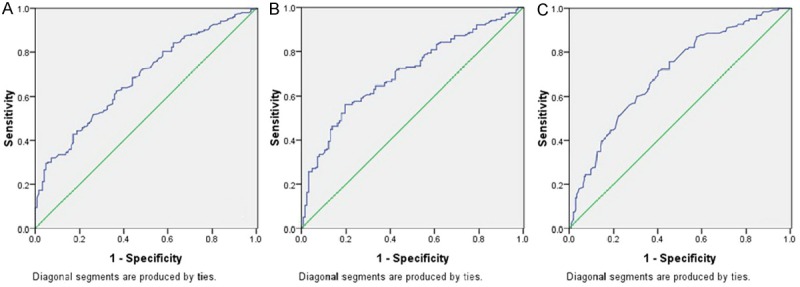
Figure 1.

ROC curves for survival prediction (CSS) were plotted to verify the optimum cut-off points for NLR (A), PLR (B) and LMR (C). ROC curves for CSS were plotted to verify the optimum cut-off points for NLR, PLR and LMR, which were 3.45, 166.5, and 2.30, respectively. The areas under curve (AUC) for NLR, PLR and LMR were 0.680 (P<0.001), 0.701 (P<0.001) and 0.703 (P<0.001), respectively.
