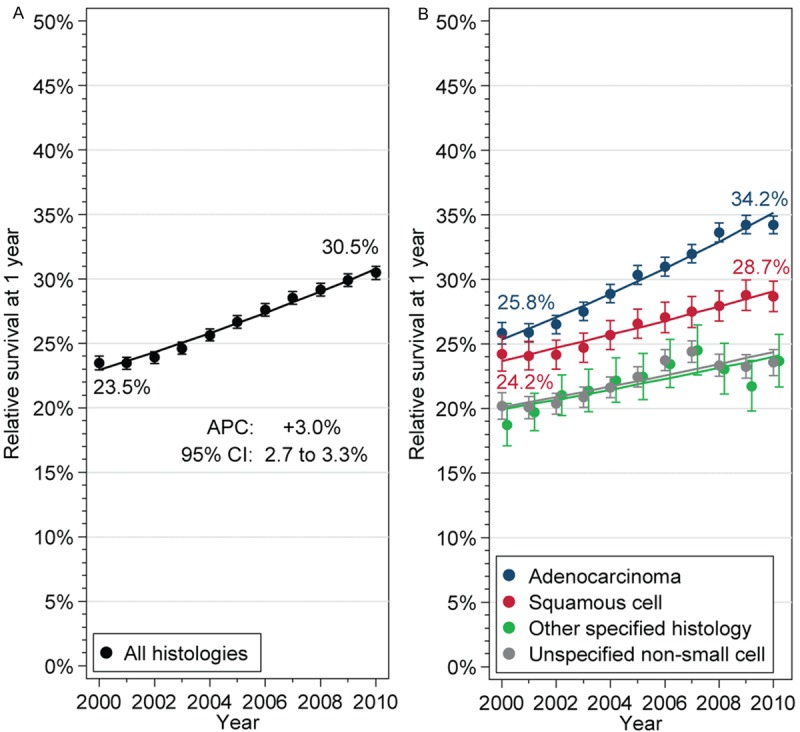
Figure 2.

Trends in 1-year relative survival of patients with metastatic non-small cell lung cancer, for the entire cohort (A), and stratified by histologic subgroup (B). Point estimates with 95% confidence intervals (bars), and fitted values from log-linear models (lines) are shown. Selected point estimates in 2000 and 2010 are listed. APC, annual percent change; CI, confidence interval.
