
Figure 3. Statistical correlation map for the two orbital radii scales.
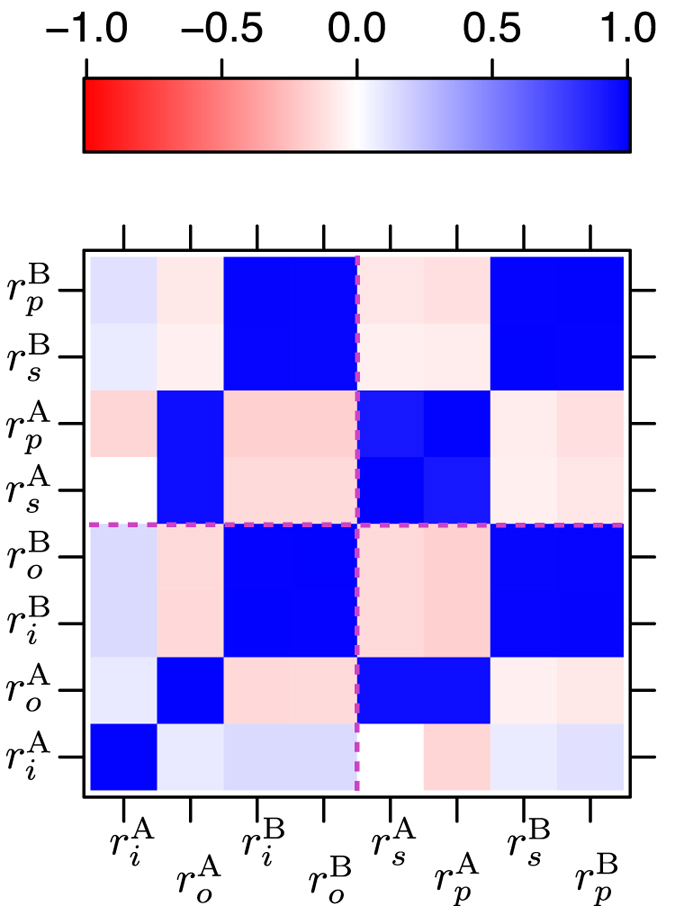
ri and ro are the inner and outermost orbital radii, respectively, of A- and B-atoms from the Waber-Cromer scale. rs and rp are the s- and p-orbital radii, respectively, of A- and B-atoms from the Chelikowsky scale. Red (negative) and blue (positive) color indicate strong inverse and direct correlation, respectively. Pink dotted lines are drawn as a guide to the eye for improved readability, which separates the Waber-Cromer scale from Chelikowsky scale.