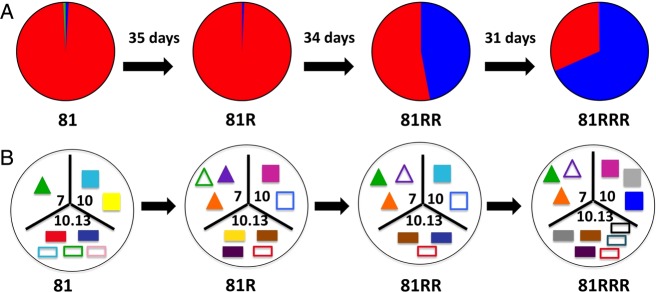
Figure 4.

Pictoral representation of pvmsp1 haplotypes and microsatellite alleles MS7, MS10, and MS10.13 found in patient 81 through 4 consecutive P. vivax parasitemic episodes. In Panel A, pie slices reflect the proportion of sequencing reads assigned to each pvmsp1 haplotype variant within each episode (CAM.00 in red, CAM.01 in blue, CAM.51 in yellow). In Panel B, microsatellite alleles for PvMS7, PvMS10, and MS10.13 are depicted as different colored triangles, squares, and rectangles, respectively, within each tripart segment. Alleles that appeared only as minor peaks (less than one-third height of the dominant allele peak) are depicted as hollow shapes.
