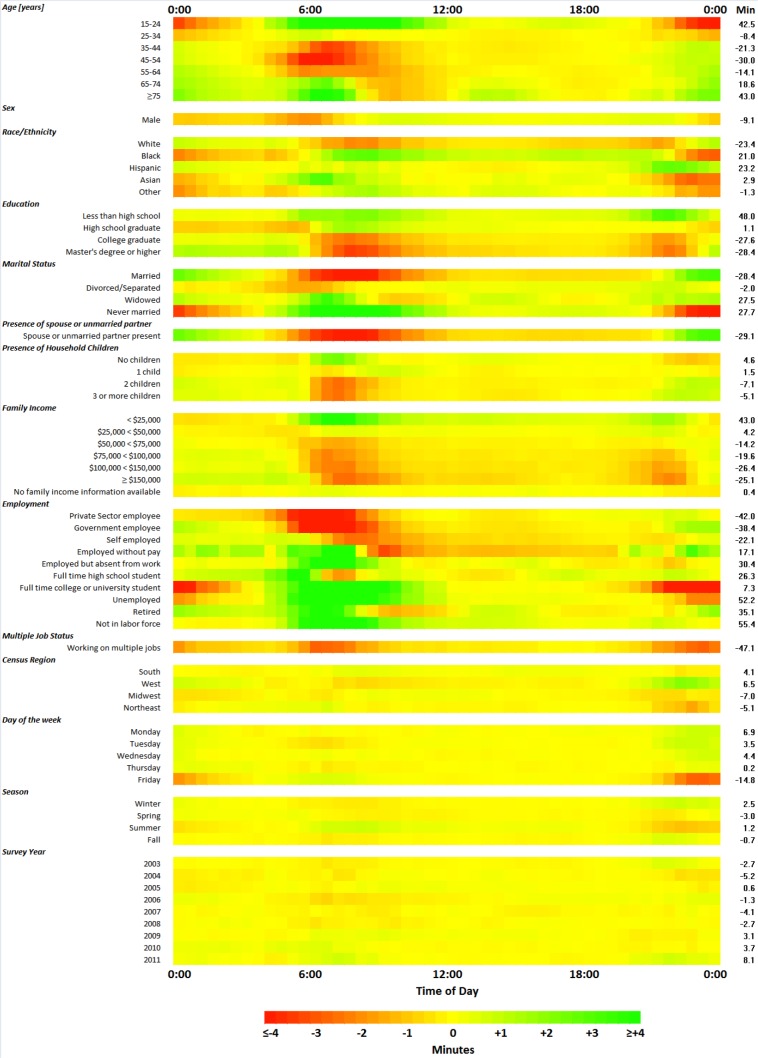
Figure 1.
Sleep lost or gained by time of day on weekdays for several sociodemographic categories (N = 60,887). Each cell represents a 30-min time window and the amount of sleep lost or gained compared to all other respondents within a given category. The color indicates the amount of sleep lost (red) or gained (green). For example, 15- to 24-year-old respondents slept 3.3 min less than ≥ 25-year-old respondents in the 0:00-0:29 time window on weekdays. The numbers in the column labeled “Min” show how many minutes of sleep are lost or gained per 24 h compared to all other respondents within a given category. All analyses are based on unadjusted linear regression models (i.e., separate models were run for each category).

