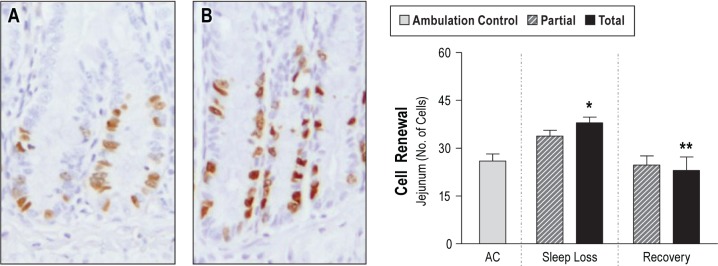
Figure 4.

Replication of cells affected by sleep loss. Left: representative micrographs (100X magnification) illustrate bromodeoxyuridine (BrdU) incorporation into proliferating cells in the crypts of jejunum in an ambulation control (A) and a sleep deprived rat (B). Right: results of quantitative analysis results in ambulation control (AC) rats (gray bar, n = 7) and in partially (hatched bar) and totally (solid bar) sleep deprived rats during 10 days of sleep loss (n = 7–9 per group), and after 2 days of recovery sleep after sleep loss (n = 6–7 per group). Values shown are the number of positively labeled cells relative to the total number of crypt cells, expressed as the mean ± standard error. * P < 0.05 for the comparison of differences between sleep deprivation and AC and ** P < 0.01 for the comparison between recovery and sleep deprivation.
