FIGURE 3.

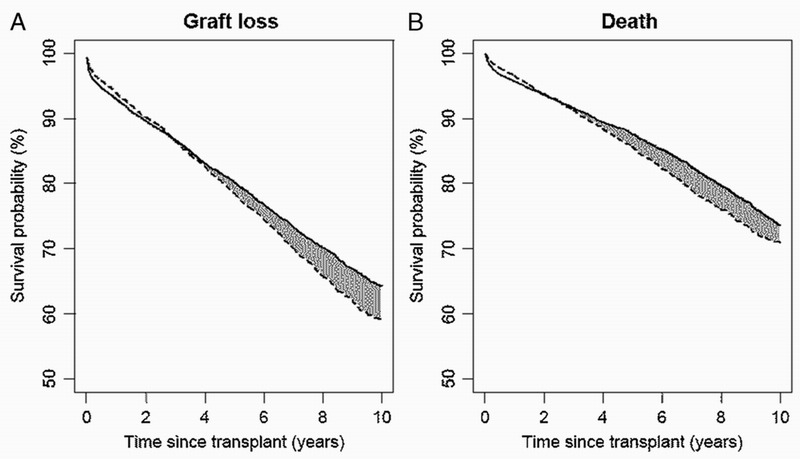
Estimated survival curves for (A) graft loss and (B) death adjusted for patients and donor characteristics using the method of Chen and Tsiatis.2 Solid line indicates SPK and dashed line indicates KTA.

Estimated survival curves for (A) graft loss and (B) death adjusted for patients and donor characteristics using the method of Chen and Tsiatis.2 Solid line indicates SPK and dashed line indicates KTA.