
FIGURE 3.
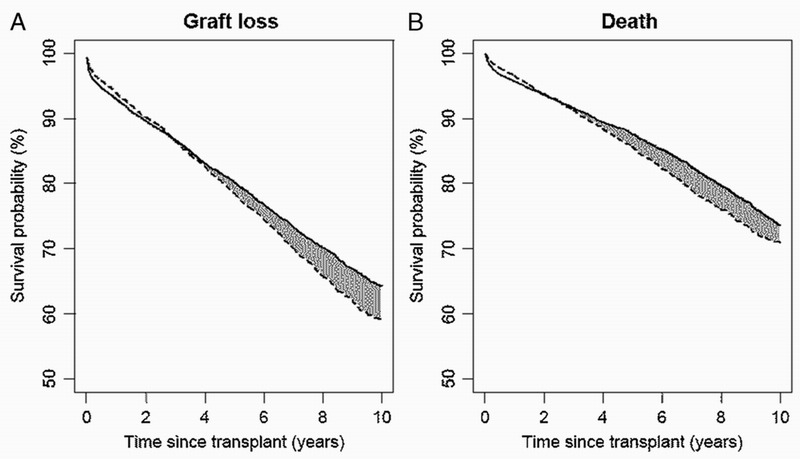
Estimated survival curves for (A) graft loss and (B) death adjusted for patients and donor characteristics using the method of Chen and Tsiatis.2 Solid line indicates SPK and dashed line indicates KTA.
Official websites use .gov
A
.gov website belongs to an official
government organization in the United States.
Secure .gov websites use HTTPS
A lock (
) or https:// means you've safely
connected to the .gov website. Share sensitive
information only on official, secure websites.
Estimated survival curves for (A) graft loss and (B) death adjusted for patients and donor characteristics using the method of Chen and Tsiatis.2 Solid line indicates SPK and dashed line indicates KTA.