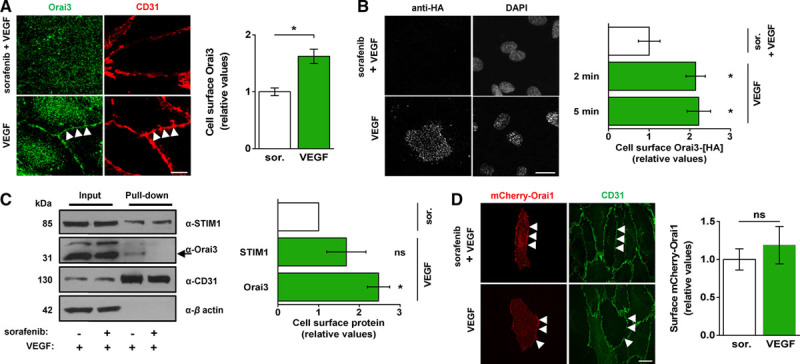
Figure 3.

Selective Orai3 plasma membrane accumulation is evoked by vascular endothelial growth factor (VEGF). A, Representative images and mean data of cells treated with sorafenib (1 μmol/L) or vehicle (DMSO [dimethyl sulfoxide]) before stimulation with VEGF (30 ng/mL) for 5 minutes. Cells were labeled with anti-Orai3 antibody (Orai3, green) and anti-CD31 antibody (CD31, red). Scale bar, 2 μm. Arrows point to example cell perimeter as indicated by CD31 labeling. Mean data shows cell-surface Orai3 (n=6/N=18 each). B, Representative images and mean data of human umbilical vein endothelial cells (HUVECs) overexpressing Orai3-[HA] and treated as in (A). Cells were labeled with the anti-HA antibody. Scale bar, 10 μm. VEGF was applied for 5 minutes (n=3/N=15 each) or 2 minutes (n=3/N=45 each). C, Representative immunoblot and mean data from 3 experiments for cells treated as in (A) before biotinylation. The arrow points to Orai3 labeled by anti-Orai3 antibody (α-Orai3). The protein band above it, labeled nonspecifically by α-Orai3, has unknown identity. Where indicated (+), sorafenib (sor.) and VEGF were used at 1 μmol/L and 30 ng/mL, respectively. VEGF was applied for 5 minutes. D, Representative images and mean data for mCherry-Orai1 surface localization in cells treated as in (A); (sor., n=7/N=29; VEGF, n=4/N=14). Scale bar, 10 μm. All data are from HUVECs. Data are represented as mean±SEM; *P<0.05; ns P>0.05.
