Figure 1.
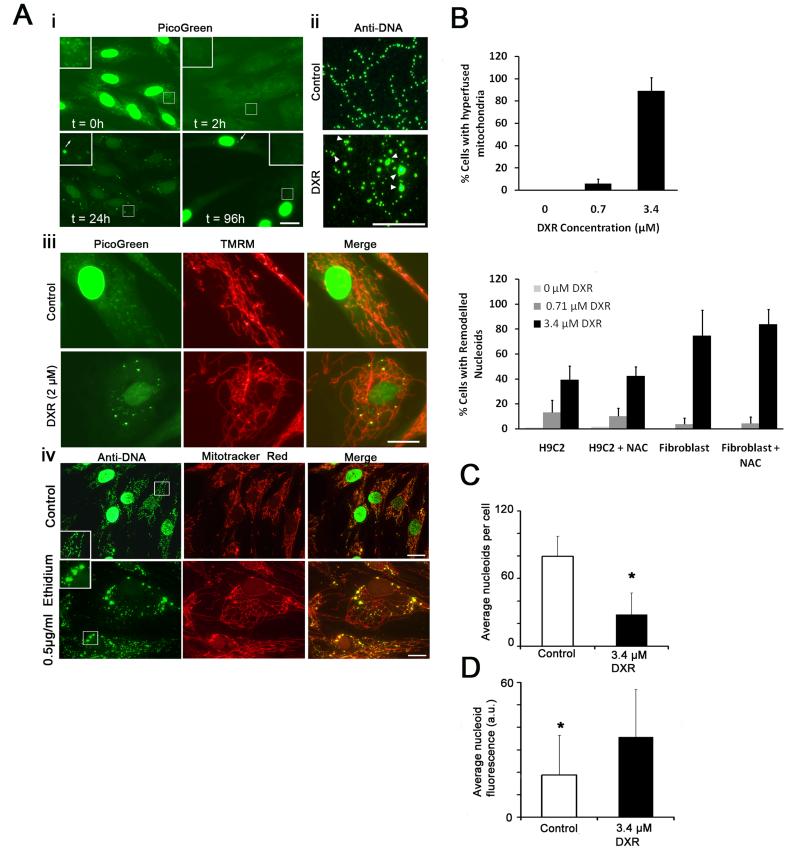
DXR and ethidium alter mtDNA nucleoids and mitochondrial morphology. (Ai) Time-course of PicoGreen labelling of live primary human fibroblasts incubated with DXR (t = hours of exposure). (Aii) Anti-DNA (IgM1) labelling of mtDNA within DXR (3.4 μM 24 hours) and vehicle treated fibroblasts. (Aiii) PicoGreen/TMRM co-labelling of DXR/vehicle treated fibroblasts (2 μM 24 hours). (Aiv) Anti-DNA (IgM1)/Mitotracker red labelling of mtDNA/mitochondria within fibroblasts treated with vehicle or ethidium bromide (0.5μg/ml 24 hours). (B upper) Percentage of DXR/vehicle treated fibroblasts exhibiting mitochondrial interlinking after 24 hours (n = 200). (B lower) Percentage of DXR/vehicle treated human fibroblasts and H9C2 rat cardiomyocytes exhibiting nucleoid remodelling after 24 hours, in the presence/absence of 100 μg/mL N-acetylcysteine (n = 200). (C) Mean nucleoids per cell within fibroblasts treated with DXR (3.4 μM 24 hours) or vehicle (n = 10). (D) Average nucleoid fluorescence (a.u. = arbitrary units) within fibroblasts treated with DXR/vehicle (3.4 μM 24 hours) (n = 100). * P = <0.05 versus control. Error bars + S.D. Results are representative of three independent experiments. Size bars: 20μm except Aii (10μm).

