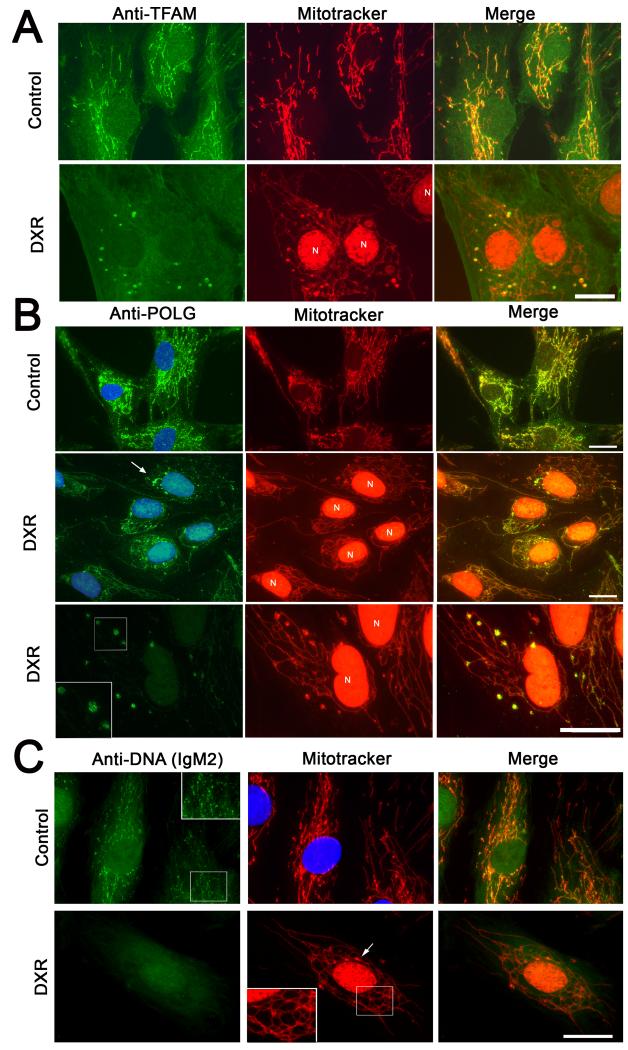
Figure 2.
DXR alters the distribution of TFAM, mtSSB and POLG and reduces mtDNA binding by Anti-DNA IgM2. (A) Anti-TFAM/Mitotracker labelling of fibroblasts incubated with vehicle/DXR (3.4 μM 24 hours). Retained DXR fluorescence within the nuclei is indicated by ‘N’. (B) Anti-POLG/Mitotracker labelling of fibroblasts incubated with vehicle or DXR for 24 hours (3.4 μM 24 hours). DAPI was used to stain nuclei blue. DXR induced POLG accumulations are arrowed. The bottom panels show a higher magnification of a POLG labelling cell acquired using reduced camera exposure. (C) Anti-DNA IgM2/Mitotracker labelling of fibroblasts incubated with vehicle/DXR (3.4 μM 24 hours). Arrow shows a mitochondrial swelling indicating a remodelled nucleoid. Size bars: 20μm. Results are representative of at least three independent experiments.

