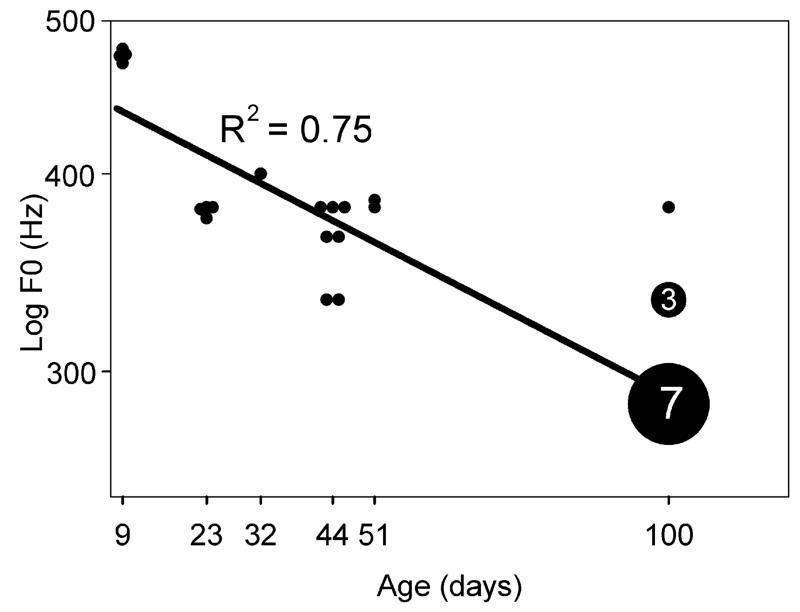
Fig. 3.
Scatter plot showing the fundamental frequency (F0) of 30 examples of the short purr from animals of different ages. The larger symbols have greater numbers of examples – in this case 3 and 7. The linear regression line has a negative slope and a correlation value of 0.75. The F0 of the calls decreases as the animals increase in age/size.

