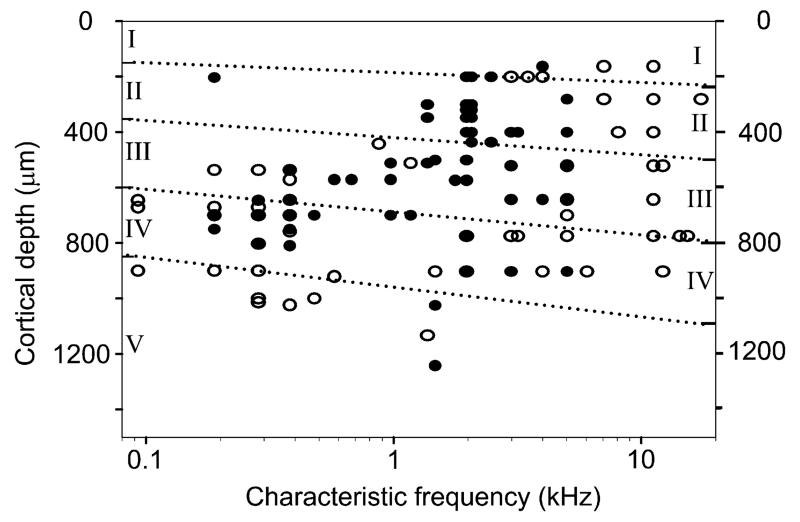
Fig. 5.
Scatter plot showing the characteristic frequencies (CFs) and depths of recorded units. The solid black circles represent units that responded to at least one version of the purr while the clear circles represent units which did not give a significant response to any version of the purr. The thickness of AI varies along the tonotopic gradient and the thickness of the layers at the rostral, low-frequency end is indicated on the left axis while the high-frequency end is indicated on the right axis.

