
Figure 1.
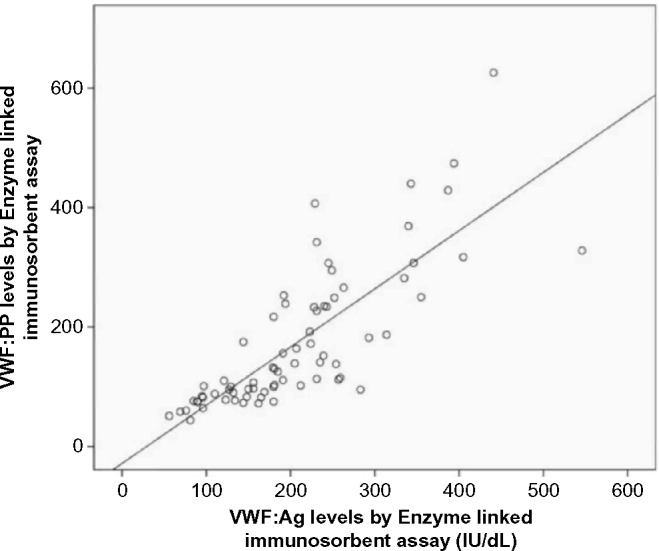
Scatterplot of the relationship between the levels of VWF:Ag and VWFpp determined by the ELISA method (Spearman’s rho = 0.849, P < 0.001).
Official websites use .gov
A
.gov website belongs to an official
government organization in the United States.
Secure .gov websites use HTTPS
A lock (
) or https:// means you've safely
connected to the .gov website. Share sensitive
information only on official, secure websites.
Scatterplot of the relationship between the levels of VWF:Ag and VWFpp determined by the ELISA method (Spearman’s rho = 0.849, P < 0.001).