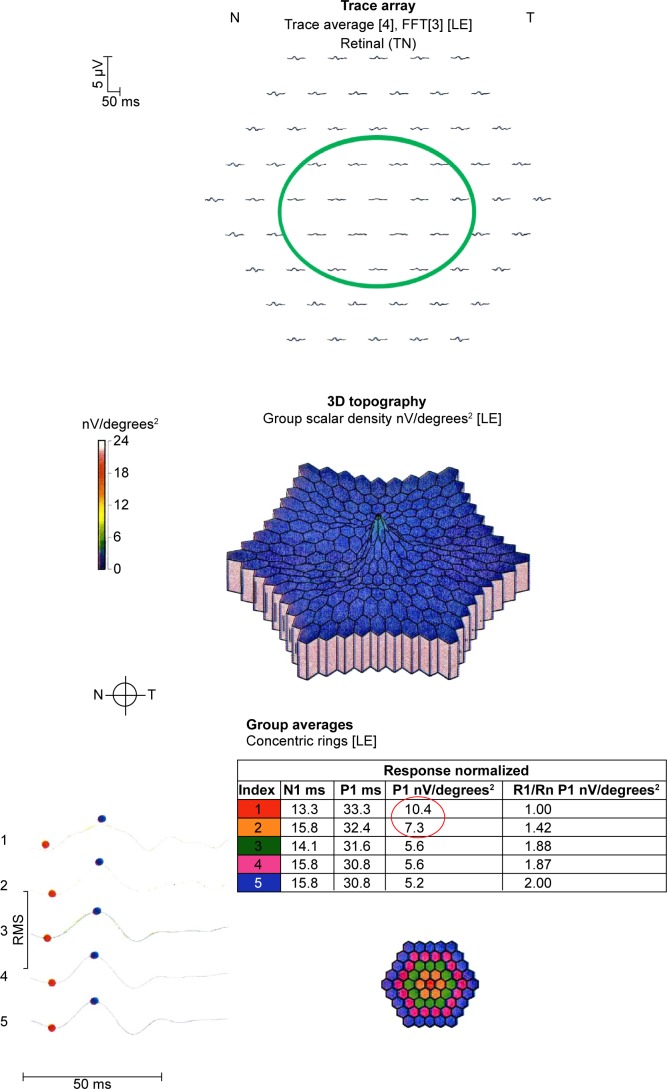
Figure 4.
mfERG of a patient taking hydroxychloroquine at toxic doses who developed retinopathy.
Note: The mfERG shows reduced amplitudes in rings R1 and R2 (red-circled values) and flattened waveforms in the green-circled locations.
Abbreviations: FFT, fast fourier transform; LE, left eye; T, temporal; N, nasal; TN, temporal-nasal; N1, implicit time of the initial negative wave trough; P1, implicit time of the initial positive wave peak; R1, ring 1; Rn, ring n; RMS, root mean square.

