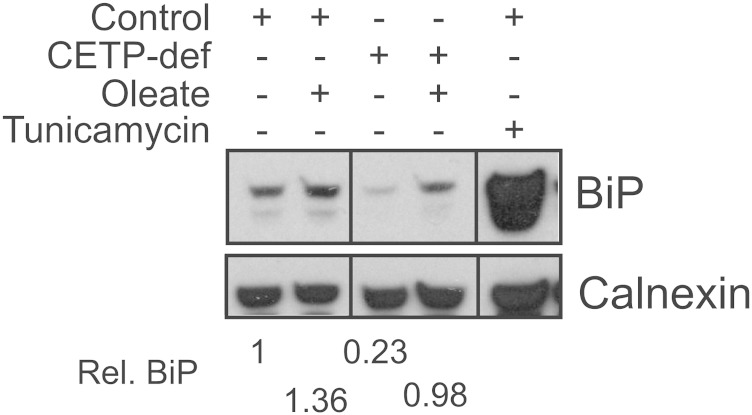
Fig. 3.
Evaluation of ER stress status. Cells were treated with 200 μM oleate/BSA or tunicamycin (5 μg/ml), as indicated, for 48 h. Cells were lysed and 30 μg protein aliquots fractionated by SDS-PAGE. Western blots for the ER stress marker, BiP, and calnexin (loading control) are shown. Results are typical of two experiments and representative of results with two other ER stress proteins, as noted in the text. CETP-def, CETP-deficient; Rel., relative.

