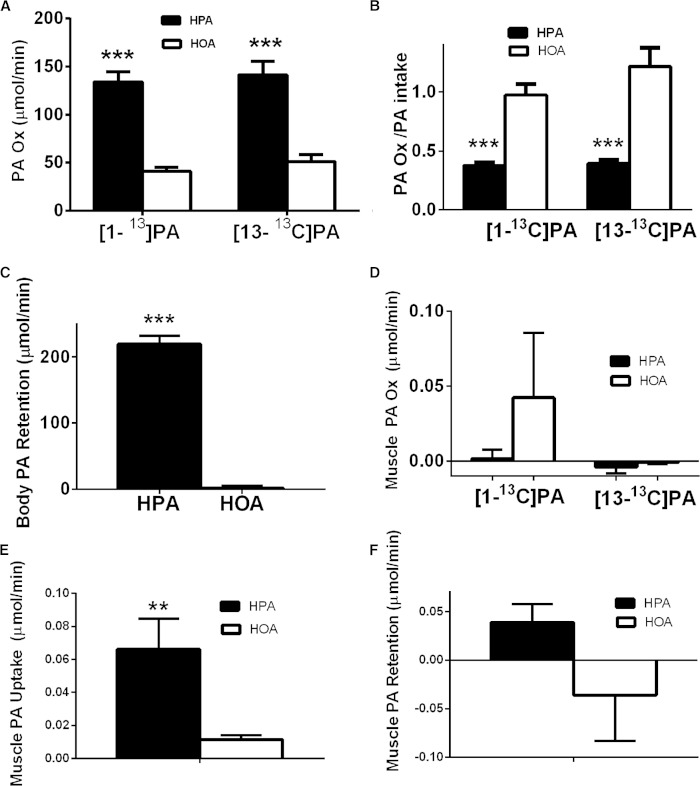
Fig. 2.
PA oxidation and retention is increased on the HPA diet. As described in detail in the Materials and Methods, studies of the oxidation of [1-13C]PA and [13-13C]PA tracers were carried out in random order, in the fed state, using an oral tracer administration protocol for the HPA, low PA, and HOA diets. Both whole body and muscle parameters are calculated based on data obtained from blood samples (see the Materials and Methods, as well as detailed equations in the online data supplement). Black bars indicate the HPA diet and white bars indicate the HOA diet. **P ≤ 0.01 or ***P ≤ 0.0001 for diet differences. A: The whole body rate of oxidation of PA (PA OX) based either on the [1-13C]PA tracer or the [13-13C]PA tracer (micromoles per minute) (n = 17). B: The whole body rate of oxidation of PA, using either tracer, expressed as a fraction of PA intake (n = 17). C: Whole body PA retention (PA intake − PA oxidation) (micromoles per minute). Data are presented for the [1-13C]PA tracer only as described in the text (n = 17). D: Skeletal muscle oxidation of PA (micromoles per minute, across the forearm muscle) based either on the [1-13C]PA tracer (n = 15) or the [13-13C]PA tracer (n = 12). E: Skeletal muscle PA uptake (micromoles per minute, across the forearm muscle). Average uptake on both tracer days for each diet is presented because position of label has no effect (n = 16 for the [1-13C]PA tracer and n = 13 for the [13-13C]PA tracer). The values for both tracer days were averaged when both values were available. F: Skeletal muscle PA retention based on the [1-13C]PA tracer (micromoles per minute, across the forearm muscle) (n = 15).

