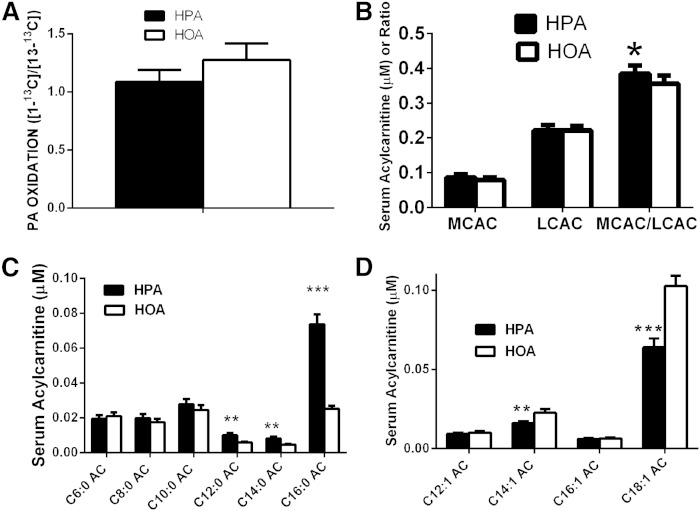
Fig. 3.
Discordant interpretation of completeness of FA OX based on tracer data and AC profiling. The oxidation of PA was assessed during a 7 h protocol in which tracers for PA and diet formula were administered by mouth every 20 min. The [1-13C]PA and [13-13C]PA tracers were administered in random order for each of the experimental diets (HPA, HOA). As described in Materials and Methods, oxidation of each tracer was based on plateau samples obtained during the last hour of tracer administration. AC profiling was conducted on blood obtained at the end of the tracer administration protocol (n = 17 for all diet comparisons). Black bars indicate the HPA diet and white bars indicate HOA diet. *P ≤ 0.05, **P < 0.01, and ***P < 0.001, for differences between tracers (repeated measures ANOVA, except for AC statistics, which were based on a paired t-test). A: Ratio of the whole body rates of PA oxidation measured with tracers for PA labeled on positions C1 and C13 (C13/C1 data presented). B: Serum AC profile averaged for the two tracer days on each diet (see text for calculation). C: Effects of diets on the serum concentrations of specific saturated ACs. D: Effects of diets on the serum concentrations of specific monounsaturated ACs.

