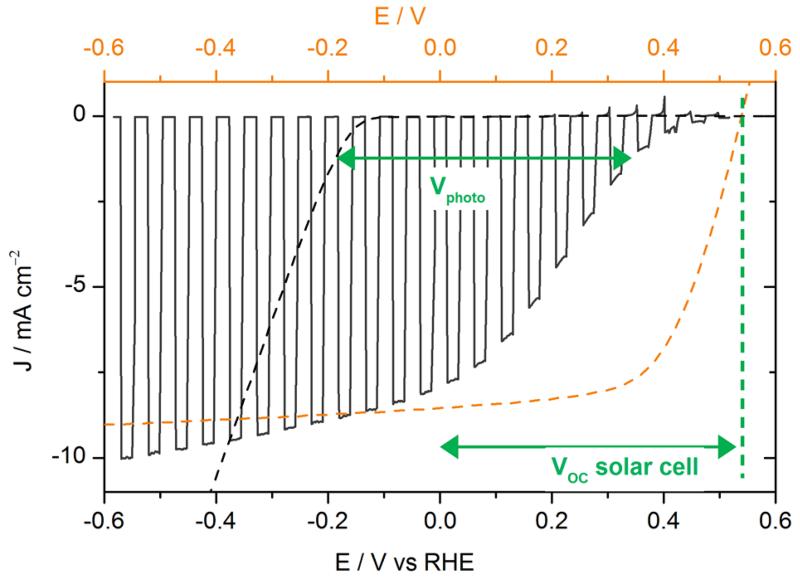
Figure. 1.
Voltammogram recorded at 50 mV s−1 in 0.5 M H2SO4 with chopped visible light for an ITO\PEDOT:PSS\P3HT:PCBM\LiF\Al\Ti\MoS3 photocathode (black line, electrode area 0.32 cm2), and recorded at 5 mV s−1 in 0.5 M H2SO4 for an ITO\MoS3 cathode (black dashed line, electrode area 0.28 cm2). Potentials are referred to the RHE (bottom axis). The current-voltage curve of an ITO\PEDOT:PSS\P3HT:PCBM\LiF\Al solar cell (orange dashed line, top axis) is shown for comparison.

