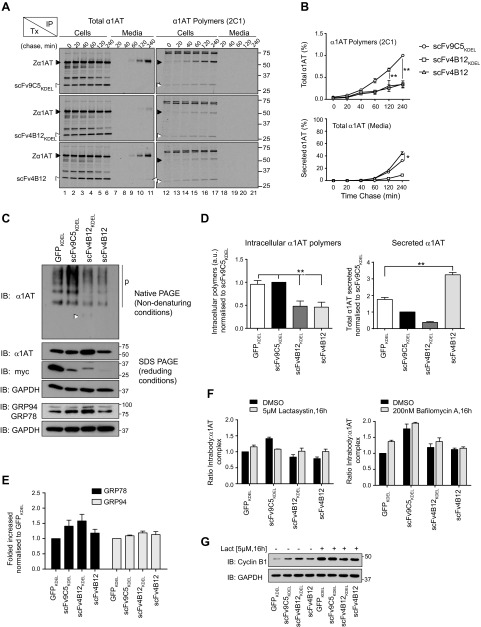
Figure 5.
The scFv4B12 intrabody reduces the polymerization of Z α1-antitrypsin in a cell model of disease. A) COS-7 cells were cotransfected (Tx) with Z α1-antitrypsin and scFv9C5KDEL, scFv4B12KDEL, or scFv4B12. Twenty-four hours after transfection, cells were pulse-labeled with [35S]-Met/Cys for 20 minutes and chased for the indicated times. α1-Antitrypsin from cell lysates and culture media was immunoprecipitated with a polyclonal antibody (total α1-antitrypsin) or mAb2C1 (α1-antitrypsin polymers) by splitting each sample into 2 equal aliquots. Samples were resolved by 10% (v/v) SDS-PAGE and detected by autoradiography. Black arrowheads indicate Z α1-antitrypsin (intracellular 52 kDa species and extracellular 55 kDa species) and white arrowheads indicate scFvs (32 kDa species). B) Quantification graphs from the experiment performed in A (n = 3); *P < 0.05; **P < 0.01, according to analysis of variance test, followed by Bonferroni’s post hoc test. C) COS-7 cells were cotransfected with Z α1-antitrypsin and scFv9C5KDEL, scFv4B12KDEL, scFv4B12, or GFPKDEL as indicated. Cell lysates were collected after 24 hours and analyzed either on 10% (v/v) SDS- or nondenaturing PAGE and immunoblotted for α1-antitrypsin, myc-tag (scFv), KDEL (for detection of both GRP78 and GRP94 ER chaperones), and glyceraldehyde 3-phosphate dehydrogenase (GAPDH). D) Cell lysates from experiments performed in C were subjected to sandwich ELISA for quantification of intracellular α1-antitrypsin polymers (using mAb2C1; right), and both cell lysates and culture media were analyzed by sandwich ELISA to quantify the percentage of secreted total α1-antitrypsin (using mAb3C11, which recognizes all conformers of α1-antitrypsin and does not compete with mAb9C5; left). Histograms represent the means ± sem of 5 independent experiments. **P < 0.01; Mann-Whitney test. E) Histogram of 3 independent experiments as in C showing fold increase of GRP78 and GRP94 normalized to loading control and then to GFPKDEL (means ± sem). Mann-Whitney test (n = 3) showed nonsignificant differences. F) COS-7 cells cotransfected as in C were treated either with 5 µM lactacystin (left) or 200 nM bafilomycin (right) for 16 hours. α1-Antitrypsin:intrabody complex was quantified by sandwich ELISA using a polyclonal anti-α1-antitrypsin antibody for capture and an anti-myc antibody for detection. Graphs represent the means ± sd of 2 or 3 independent experiments. G) Cell lysates from F (left) were immunoblotted for cyclin B1, a rapidly degraded proteasomal substrate, as a positive control for blocking of proteasomal activity with lactacystin.

