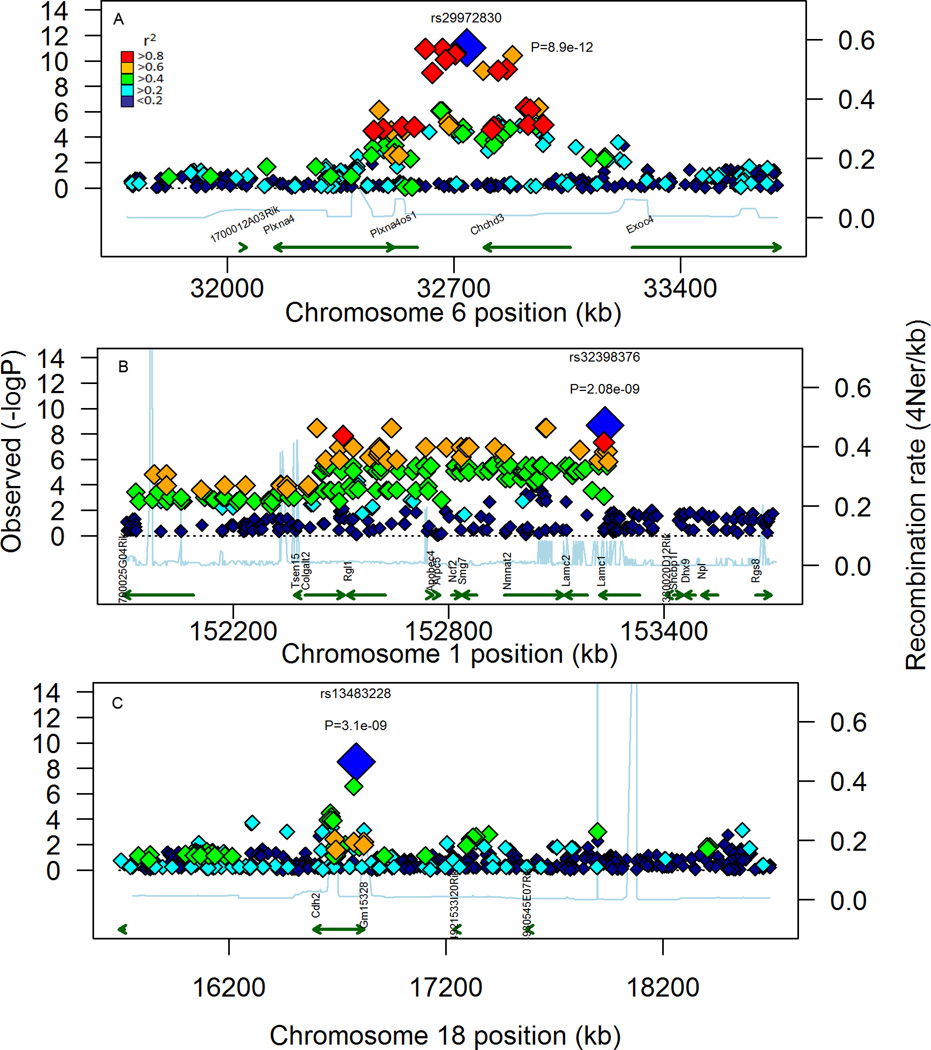
Figure 8. Visualization of local LD in the top 3 candidate regions.
LD was assessed by calculating r2 for SNP within a region that was 1 MBP on either side of the lead SNP for the top 3 associations based on P-value. These associations were detected on MMU 6 (A), 1 (B), and 18 (C). The associated SNP are plotted along with their respective P-values, as well as recently derived estimates of local recombination rates (Brunschwig et al 2012). Potential candidate genes are also shown as well as potential causal SNP contained within and around genes. For each plot, the lead SNP is shown as the largest symbol, colored blue along with it respective id and p-value. Symbols coded red are SNP in high LD (r2 >0.8) with the lead SNP, Symbols colored orange are in moderate LD (0.6 < r2 < 0.8). For green symbols, r2 is between 0.4 and 0.6. Cyan symbols have low LD (0.2 < r2 < 0.4). Blue symbols have no linkage (r2<0.2).

