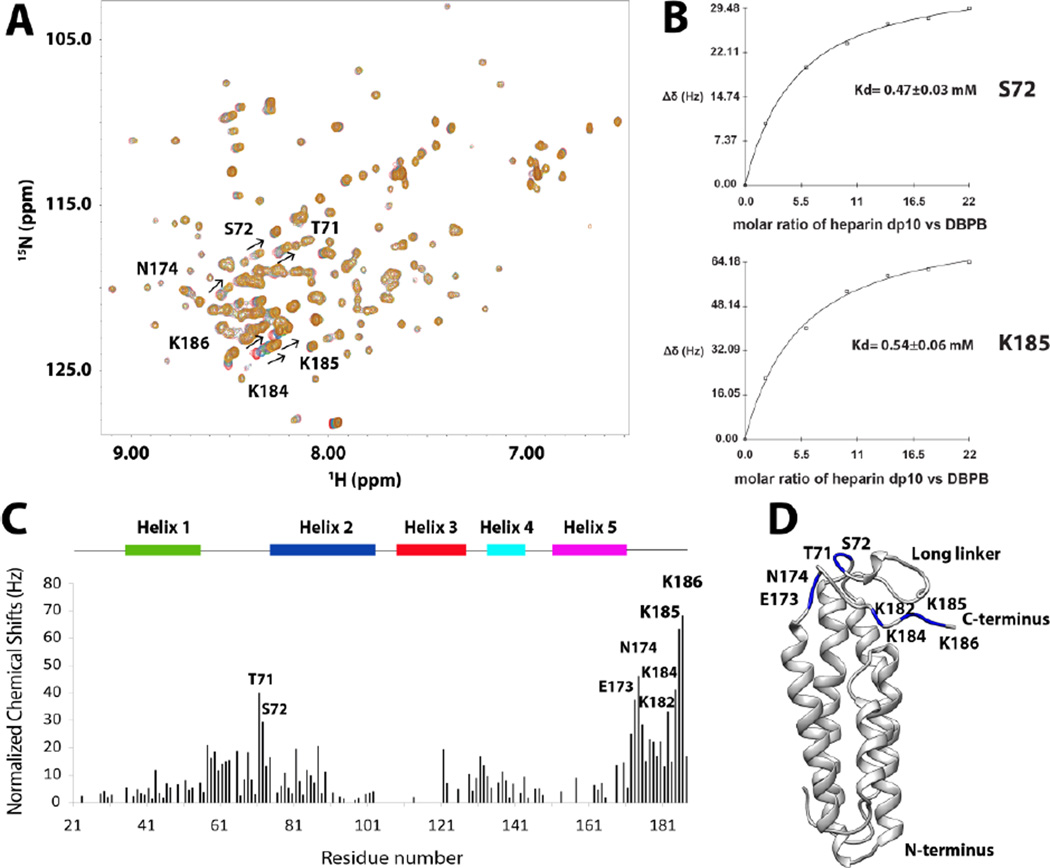
Figure 6. DBPB titration with heparin dp10.
(A) 1H-15 N HSQC overlays of WT B31 DBPB with increasing concentrations of heparin dp10. Signals with large migrations are labeled with their residue numbers and arrows to indicate migration directions. T71, S72, E173, N174, K182, K184, K185 and K186 have the largest migration. Contours are color-coded with increasing concentrations of heparin dp10 (0, 0.2, 0.6, 1.0, 1.4, 1.8 and 2.2 mM). (B) Binding curves of DBPB residues S72 and K185 when titrated with heparin dp10. (C) Residue specific heparin-induced chemical shift changes. Normalized chemical shift perturbations to backbone amide nitrogen and proton by heparin dp10 are displayed. (D) Ribbon conformer of DBPB in the same orientation as in Figure 4B with residues showing large perturbations colored blue.

