Fig. 4.

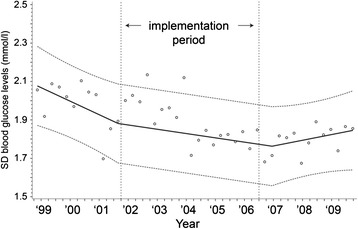
Means of individual standard deviations for serum glucose concentrations during the study period. y = 2.085461 - 0.00019*time1 + 0.000133*time2 + 1.342228*time3

Means of individual standard deviations for serum glucose concentrations during the study period. y = 2.085461 - 0.00019*time1 + 0.000133*time2 + 1.342228*time3