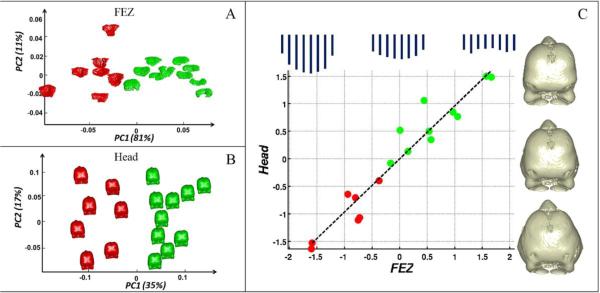
Fig. 4.
(A) Plot of PC1 and PC2 scores for FEZ topography that clearly separate chickens (red) from ducks (green). (B) PC1 and PC2 scores for head shape, with PC1 explaining 35% of the total shape variation and sharply discriminating chickens from ducks. (C) First pair of canonical directions in the FEZ and head morphospaces. The plot shows a clear separation of chickens from ducks, as well as a strong correlation (ρ = 0.96) between FEZ morphology and head shape. The plot includes a schematic illustration of the variation of the FEZ topography vectors and 3D head shape changes along the first pair of canonical directions.

