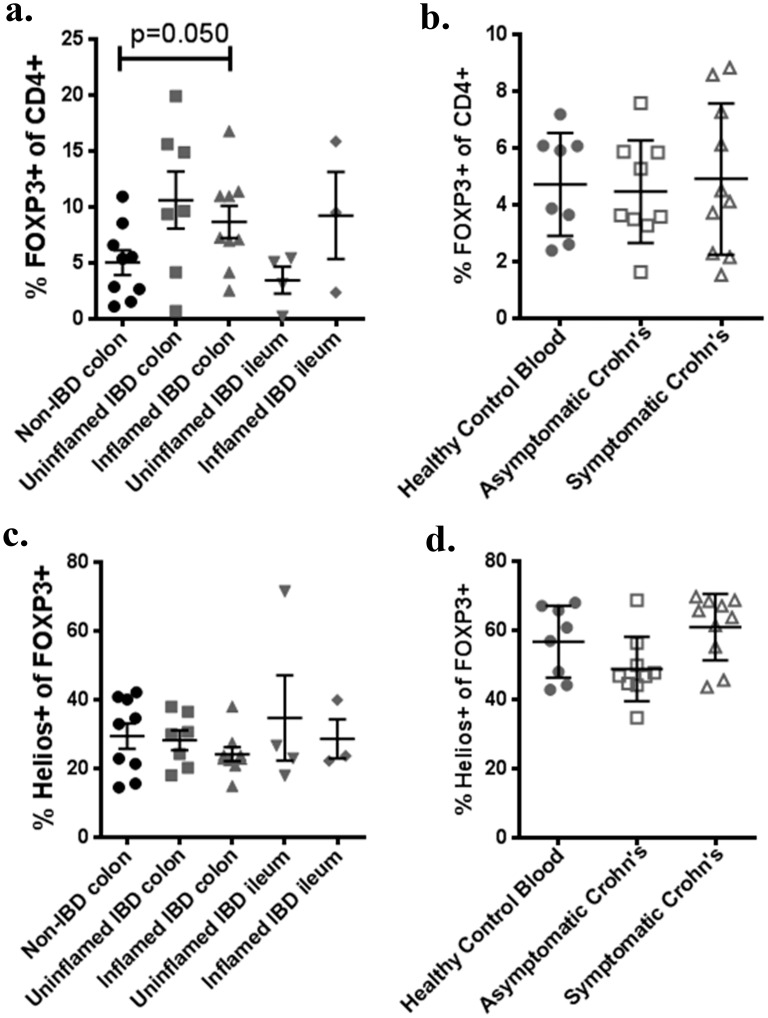
Fig 3. Increased intestinal FOXP3+ T cells in IBD are not predominantly Helios-.
Homegenized LPL (a,c) or PBMC (b,d) were thawed and stained according to Table 1, or with isotype control antibodies. Gating on CD3+, CD4+ T cells, the percent of colonic or ileal LPL expressing FOXP3 is shown according to whether tissue was inflamed or not (a). The percent of CD3+, CD4+ PBMC expressing FOXP3 is also shown for a separate cohort of Crohn’s patients, with or without symptoms, or for matched controls (b). Data for a and b was re-gated on CD3+, CD4+, FOXP3+ cells and the percent expressing Helios is shown as above (c, d). Each point represents a unique specimen. Bars indicate means and standard deviations. For c and d, each data point is the mean of three independent assays.

